TotalView delivers unbeatable platform, language, and compiler support for C, C++, and mixed-language Python – C/C++ applications.
- Totalview 2025.2
- TotalView 2025.1
- TotalView 2024.4
- TotalView 2024.3
- TotalView 2024.2
- TotalView 2024.1
- TotalView 2023.4
- TotalView 2023.3
- TotalView 2023.2
- TotalView 2023.1
- TotalView 2022.4
- TotalView 2022.3
- TotalView 2022. 2
- TotalView 2022.1
TotalView is the industry leading software debugger for developers to quickly find and resolve bugs in their complex and parallel C, C++, Fortran, and Python applications. TotalView 2025.2 adds significant AMD GPU performance and stability improvements when utilizing Wave Thread debugging mode.
TotalView 2025.2 also adds new features, platform updates, and enhancements, including:
- Fortran Module View: During a Fortran program’s execution, TotalView will locate all Fortran modules and associated data in the program. TotalView 2025.2 adds a new Fortran Modules View to display all found Fortran modules and variables associated with the module.
- Data View Freeze Data: The ability to freeze data in the Data View has been added as part of the TotalView 2025.2 release. Freezing Data in the Data View prevents TotalView from re-evaluating and updating the selected expression in the view when program execution continues.
- Array View Data Table Format: As part of the TotalView 2025.2 release, the ability to change the data formatfor array data displayed in the Array View’s Data Table has been added to the Array View Options dialog.
- TotalView Parallel Environment Definitions Updates: TotalView supports the popular parallel execution models including MPI, OpenMP, and others. As part of the TotalView 2025.2 release, the parallel environment definitions available in the Parallel Session dialog have been fully updated.
- Non-Interactive Reprise License Manager Configuration: The Configure_License script is used for configuring the Reprise license server. The script has been enhanced to enable non-interactive configuration of the license server. This makes it easy to set up license servers as part of an automated process.
AMD GPU Performance Improvements
TotalView 2025.2 adds significant AMD GPU performance and stability improvements when utilizing Wave Thread debugging mode.
Fortran Module View
During a Fortran program’s execution, TotalView will locate all data associated with a Fortran module. TotalView 2025.2 adds a new Fortran Modules View to display all found Fortran modules. The Fortran Modules view can be opened f rom the Window > Views > Fortran Modules menu item.
Platform Updates
TotalView 2025.2 adds support for CentOS 10.
Bug Fixes and Performance Improvements
Numerous bug fixes, security fixes, and performance improvements have been addressed, including update of open-source third-party software packages used by TotalView.
View Full Release Notes
For more details, please refer to the TotalView release notes, where you can see more details and specs on how to enable various features, what to expect from updates, and info about any features on hold.
TotalView 2025.1
TotalView 2025.1 builds on its powerful debugging capabilities with the following new features, platform updates, and enhancements:
AMD GPU Agent and Wave Thread Debugging
TotalView 2025.1 adds the ability to debug in two different modes while debugging ROCm code on AMD GPUs, agent-thread mode and wave-thread mode. Prior to this release TotalView only provided agent-thread mode debugging. Developers can toggle a process between the two modes during the TotalView debugging session. By default, TotalView uses agent-thread mode since it is known to perform better in the debugger because it is handling far fewer debugger threads per process. However, wave-thread mode enables more granular execution control at the AMD GPU wavefront level by leveraging TotalView’s asynchronous thread control features.
Asynchronous thread control refers to a set of TotalView features that allow the debugger to individually control the execution of “threads” in a process. This granular thread execution control enables you to run and halt individual threads, single-step a group of threads in lockstep, hold and release the execution of individual threads, and create stop-thread and thread barrier breakpoints. When a ROCm process is in wave-thread mode, many of the asynchronous thread control features apply to the AMD GPU wave threads.
Benefits of using asynchronous wave thread debugging include the following:
- Wave-Level Execution Control
Increase execution-control precision by managing individual wavefronts. By controlling threads at the wave level, you can specify the execution of individual wavefronts for a finer level of control. You can set and clear stop-thread breakpoints, hold and release threads, and perform single-steps for specific waves, giving you more precise execution control than in agent-thread mode. - Enhanced GPU Breakpoint Functionality
Set breakpoints at the wave level to stop only the triggering wave threads while allowing other threads in the process to continue running. Stop-thread and thread- specific conditional breakpoints allow all waves to reach the same location. - Improved Data Visibility
Examining variables and data across wave threads within a process allows you to view variable values across the waves in a process.
For more information about using the new AMD GPU wave-thread debugging mode, see the AMD ROCm Wave Thread Debugging section in the TotalView Help at Using TotalView > GPU Debugging > Debugging AMD ROCm Programs.
TotalView Parallel Configuration Definitions Updates
When launching a parallel job from the TotalView user interface, developers select a parallel configuration from the Debug a Parallel Program session dialog. For the TotalView 2025.1 release, the available types of parallel configurations have been updated. Below is a summary of the changes:
- Various Open MPI definitions for versions up to Open MPI are combined into Open MPI. A separate Open MPI 5 parallel configuration has been created to optimize how TotalView acquires processes launched under Open MPI 5.
- Parallel configurations for different versions of MPICH, SLURM, MVAPICH and others have been cleaned up.
Obsolete and non-supported parallel configuration definitions have been removed.
See the Loading Programs from the Session Editor section in the TotalView Help for more information about launching parallel programs from TotalView’s user interface.
For information on customizing existing or adding your own parallel configuration definitions, see the MPI Startup Customizations section in the TotalView Help.
Multi-Dimensional Array Debugging Enhancements
The ability to debug multi-dimensional arrays has been enhanced in TotalView 2025.1 with the addition of the new Data Table panel in the Array View.
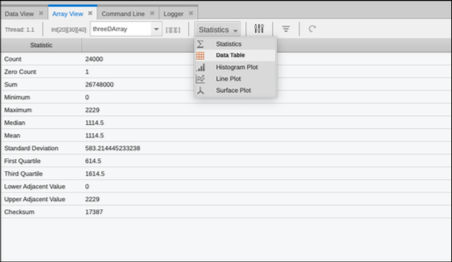
Figure 1 - New Array View Data Table Option
Once selected, the Data Table panel displays two dimensions of array data for the array expression added to the Array View.
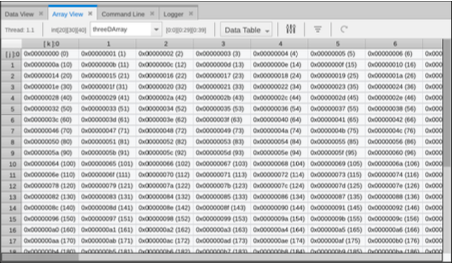
Figure 2 - Data Table Display of 3D Array Data
Which two dimensions of array data that are displayed is configured through the Array View Configuration Options dialog, selectable from the options icon in the Array View toolbar.
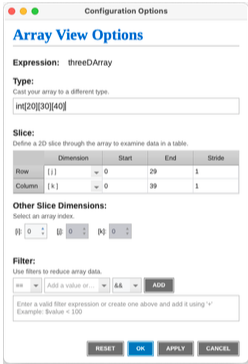
Figure 3 - Array View Configuration Options
In figure 3, dimensions j and k of a three-dimensional array are selected. Use the Slice area of the dialog and the drop-down options in the Dimension column to define which slice of the array to display in the Data Table. Slices begin with index i. The following screenshot shows data after selecting slices i and k to be displayed and the Start and End dimensions are adjusted for the dimensions of the array.
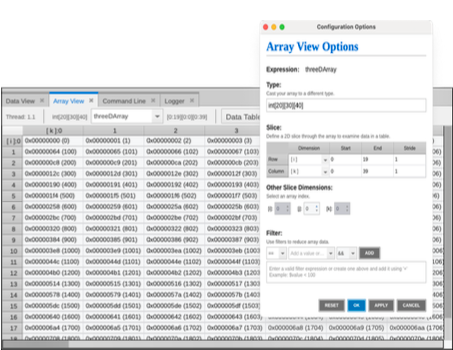
Figure 4 - Display Slices i and k
You can refine the displayed array data by adjusting the slice’s start and end indexes and setting a stride for the elements. Use the Other Slice Dimensions controls on the dialog to instruct TotalView which data indexes to traverse for the other slice dimensions not being displayed in the Data Table.
When the Array View display is changed to another view panel, such as the Line graph, the Configuration Options dialog provides a checkbox option to “Use Data Table Slice”. This will bring in the slice defined for the Data Table display and use the array data for the selected display panel. The follow diagram shows this option selected for the Line panel display.
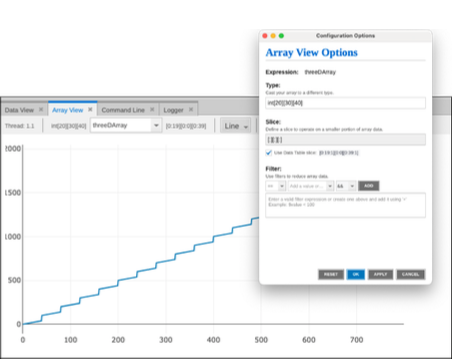
Figure 5 - Multi-Dimensional Array Data in Line Panel
Process and Group Hold
TotalView 2025.1 adds the ability to hold a process and the threads within it so they are not run when a TotalView command such as Group > Go is issued. This is useful when trying to synchronize the execution of a multi-process application. The following new menu items have been added to the Process menu:
- Process > Hold – Toggle menu item that tells TotalView to hold or release the current process. A held process will ignore all commands that would cause a thread to run.
- Process > Hold Threads – Tells TotalView to hold all threads in the current
process. Compared to Process > Hold, when you hold a process none of the threads will ever run; that is, a go has no effect. Whereas Process > Hold Threads will hold user threads and maintain their state, but manager threads will be run when a process is run with a Go command. - Process > Release Threads – Releases all threads that were held in the process.
Similarly, the ability to hold and release processes within a Control Group can be controlled with new menu items added to the Group menu.
- Group > Hold – Hold all the processes that are part of the same Control Group associated with the current thread in focus. Any commands to run processes within the group will be ignored.
Group > Release – Release all processes that were help in the Control Group.
The Group > Hold/Release menu items are a convenience. If some Processes were held and need to be released, it is more convenient to use the Group/Release rather than visiting each held process to release it from its held state. If a Control Group contains many processes and you want to execute only a small number of those processes, it is quicker to do Group/Hold and then release only those processes that you want to execute.
TotalView Documentation Changes
As part of the TotalView 2025.1 release, the system used to generate TotalView’s documentation was replaced. The new HTML documentation produced has improved formatting, navigation, and search capabilities. HTML documentation is distributed with TotalView and easily accessible through in product help through the Help menu and online. PDF documentation will no longer be produced or distributed with the product. Documentation for TotalView’s legacy user interface will not be converted to the new documentation system and will be minimally maintained. HTML and PDF versions of the Classic UI documentation will still be shipped with the product and available online.
Bug Fixes and Performance Improvements
Numerous bug fixes, security fixes, and performance improvements have been addressed, including update of open-source third-party software packages used by TotalView.
View Full Release Notes
For more details, please refer to the TotalView release notes, where you can see more details and specs on how to enable various features, what to expect from updates, and info about any features on hold.
TotalView 2024.4
TotalView 2024.4 builds on its powerful debugging capabilities with the following new features, platform updates, and enhancements:
Scalable Assembly View
TotalView 2024.4 further enhanced the Assembly View to properly handle very large amounts of assembly information by enabling incremental forwards and backwards scrolling. Numerous additional tweaks and enhancements elevate the Assembly View as a powerful tool for advanced debugging needs.
Array View Variable Rebinding Enhancement
TotalView 2024.4 enhances the Array View to rebind the array variable to the equivalent thread when the process is restarted. This improves the debugging workflow by making it easier to continue to examine variable data upon application restart. TotalView’s Data View already supported thread rebinding.
macOS Sequoia Support
TotalView 2024.4 adds support for the latest macOS release, Sequoia.
Bug Fixes and Performance Improvements
Numerous bug fixes, security fixes, and performance improvements have been addressed, including update of open-source third-party software packages used by TotalView.
View Full Release Notes
For more details, please refer to the TotalView release notes, where you can see more details and specs on how to enable various features, what to expect from updates, and info about any features on hold.
TotalView 2024.3
TotalView 2024.3 builds on its powerful debugging capabilities with the following new features, platform updates, and enhancements:
Process and Thread Navigation Improvements
TotalView 2024.3 adds the ability to cycle through processes with a group of processes and threads within a process with new Next Process/Thread, Previous Process/Thread options in the Process and Thread menu.
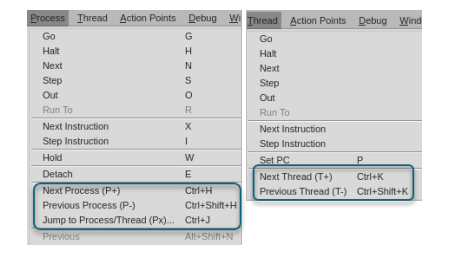
The Next Process action will cycle to the next process in the control group and Previous Process will cycle to the previous process in the group. Next and Previous Thread work similarly but within the process in focus.
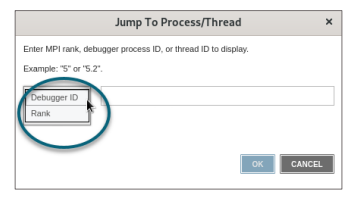
To focus on a specific process or thread use the new Jump to Process/Thread (Px)… menu
option to bring up the Jump To Process/Thread dialog. Enter a debugger ID or rank of a
process and thread you wish to focus on and press OK to have TotalView change your
process/thread focus.
Process and thread cycling and Jump to Process/Thread can be conveniently triggered using the P+, P-, Px, T+, and T- buttons in the Process and Thread view’s toolbar and also through keyboard accelerators.
Array View Filtering
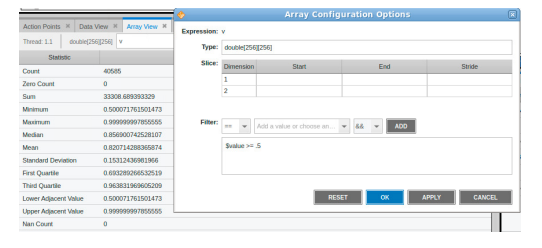
TotalView 2024.3 adds the ability to filter array contents within the Array View using new Filter options in Array Configuration Options dialog. Simply select a filter operation from the first drop down (such as '==', '<', or '<=', etc.). Then add a value to filter by or choose a special IEEE floating point value from the dropdown. If you are adding multiple filter expressions, you can also choose to && or || the expressions. Click OK or Apply to use the filter on the selected array data.
TotalView Downloads SHA256 Checksums
Beginning with the TotalView 2024.3 release TotalView file releases will use SHA256 instead of MD5 checksums to verify the downloaded files are the same as the files prepared for release.
Bug Fixes and Performance Improvements
Numerous bug fixes and performance improvements have been addressed with TotalView 2024.3.
View Full Release Notes
For more details, please refer to the TotalView release notes, where you can see more details and specs on how to enable various features, what to expect from updates, and info about any features on hold.
TotalView 2024.2
TotalView 2024.2 builds on its powerful debugging capabilities with the following new features, platform updates, and enhancements:
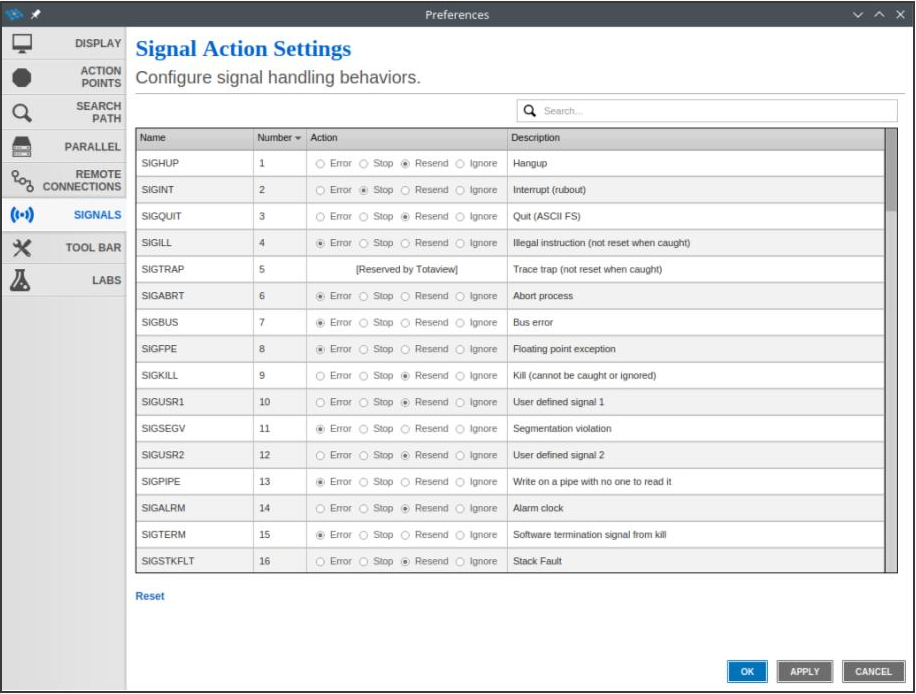
Signal Handling Control
TotalView 2024.2 adds support for customizing the actions the debugger performs for operating system signals sent to the target application. Being able to control the handling of signals is critical for the functionality of some applications, such as the Java Virtual Machine which uses signals to trigger JIT’ing of code and memory management operations. For any signal, specify the action that should be performed by TotalView:
· Error – Halt the application and put it in error state.
· Stop – Stop the application.
· Resend – Resend the signal to the application to handle.
· Ignore – Ignore the signal and do not send it to the application.
Bring up the Signal Action Settings panel by opening the TotalView Preferences dialog using the “gear” icon in the toolbar. Select the Signals panel to display all the configurable signals, and use the Search field to quickly narrow the set of signals. Signal handling actions are performed globally for any process being debugging by TotalView.
NVIDIA Grace / Hopper Support
TotalView 2024.2 adds support for NVIDIA Grace Arm based CPUs. This combined with the added Hopper support from the 2024.1 release enables TotalView to fully support debugging the NVIDIA Grace/Hopper computing environments.
OpenMP Debugging Improvements
TotalView 2024.2 improves its OpenMP debugging support with updates and additions to compiler support, the ability to display OpenMP Internal Control Variables (ICVs), added the ability to easily step in and out of parallel regions, improved OMP outlined function name demangling, improved OMP thread information added to the UI and CLI output, and other various OMPD bug fixes and performance improvements.
Note: Some OpenMP programs may require passing the "-compiler_vars" option to TotalView to enable displaying compiler-generated variables. Some compilers, especially Clang-based compilers, mark all variables inside a region as "artificial", which means the debugger should hide them from the user.
HDPI Improvements
Further HDPI improvements were made TotalView 2024.2 to improve scaling and font adjustments when running within differently scaled displays.
Bug Fixes and Performance Improvements
Numerous bug fixes and performance improvements have been addressed with TotalView 2024.2.
View Full Release Notes
For more details, please refer to the TotalView release notes, where you can see more details and specs on how to enable various features, what to expect from updates, and info about any features on hold.
TotalView 2024.1
TotalView 2024.1 builds on its powerful debugging capabilities with the following new features, platform updates, and enhancements:
TotalView Remote Client Support for Windows
TotalView 2024.1 adds support to perform remote debugging from Windows based systems
to backend systems supported by TotalView for debugging. This builds on our existing
macOS and Linux x86-64 based support for conducting remote debugging. With this new
functionality users can run the full TotalView user interface on Windows and connect over SSH to debug programs on a remote system.
Windows users should ensure their SSH connection to the server is properly configured. For password protected SSH access, enter your password in the command prompt associated with the TotalView remote connection. To bypass password prompts, ensure SSH authorized keys are properly established. Detailed setup instructions can be found in the TotalView Remote Connections documentation in the TotalView User Guide.
Reprise License Technology Change
Beginning with the TotalView 2024.1 release, TotalView is changing to use the Reprise
License Manager (RLM) technology instead of Flexera based technology. All new and
renewed TotalView licenses will be issued as RLM licenses. Flexnet Publisher (FNP) and
FlexNet Embedded (FNE) license technology is still part of TotalView and existing installation of FNP and FNE licenses will work with TotalView. Eventually, support for FNP / FNE license technology will be removed from TotalView but adequate notice will be provided before they are removed. See the updated TotalView Installation and Licensing Guide for full details about RLM and how to transition from FNP / FNE to RLM.
macOS Sonoma Support
TotalView 2024.1 adds support for macOS Sonoma.
FlexNet Embedded License Server Upgrade
TotalView 2024.1 adds support for FlexNet Embedded (FNE) version 2022.12 licensing.
TotalView’s FNE 2022.12 based license server implementation is version 2022.12.0-0.
Recent past releases supported FNE version 2020.12. The well-known log4j security
vulnerability was present in the FlexNet License Server Manager (FLSM) component in FNE 2020.12. To our knowledge, no users were using the FLSM, and its use was not mentioned in TotalView’s documentation. It was nevertheless present in past TotalView FNE license server distributions, and some users were picking up the log4j vulnerability in security scans. The FLSM is not present in FNE version 2022.12. TotalView’s 2022.12.0-0 FNE based license server distribution therefore remediates the log4j vulnerability. See Licensing in Known Issues for further information on the FNE upgrade.
Assembly View Updates
The TotalView Assembly View continues to advance in its capabilities and features. The
TotalView 2024.1 release adds better support for inline functions, improved support for GPU level assembly display, display of function labels, and other various fixes.
Enhanced High DPI Display Support
TotalView 2024.1 improves support for high DPI displays. Our application now automatically adjusts its scaling based on your monitor’s pixel density, aiming to provide optimal readability and interface usability across a wide range of display settings. See the High DPI Display Known Limitations and Recommendations section in Known Issues for tuning TotalView’s display on HDPI displays.
Bug Fixes and Performance Improvements
Numerous bug fixes and performance improvements have been addressed with TotalView 2024.1.
View Full Release Notes
For more details, please refer to the TotalView release notes, where you can see more details and specs on how to enable various features, what to expect from updates, and info about any features on hold.
View Release NotesGet Latest Release
TotalView 2023.4
Registers View
TotalView 2023.4 adds the ability to easily examine the CPU and GPU registers for target programs as they are debugged. Display the Registers View by selecting Window > Views > Registers.
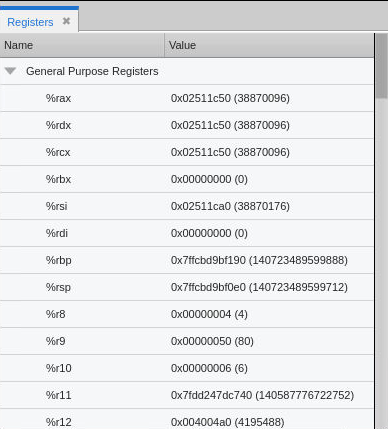
To edit the value of a register or cast it to a different type simply right click on it and select Add to Data View or drag-and-drop it into the Data View. Through the Data View the register value can be changed by double clicking on the value and entering a new one. The type can similarly be changed by double clicking on the existing type and entering a new one.
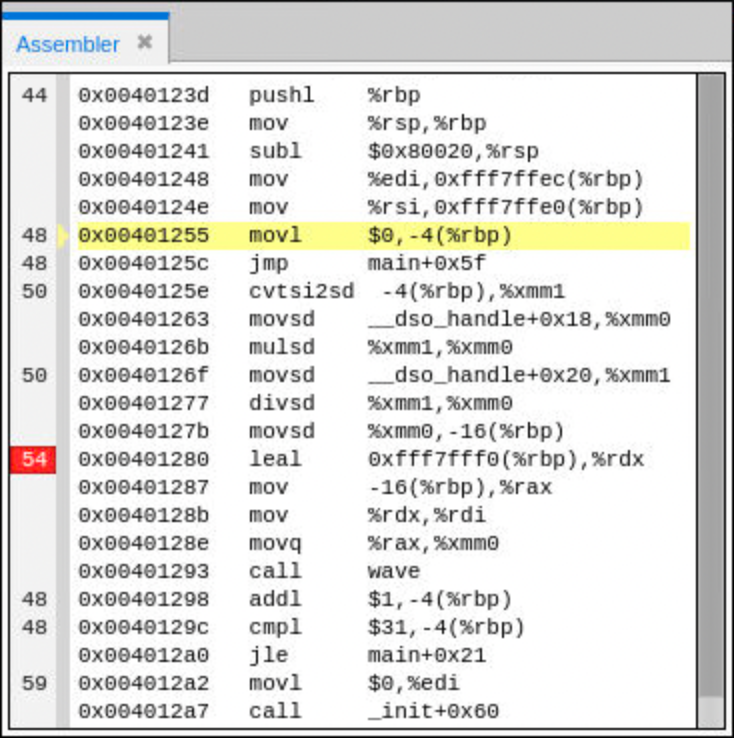
Assembly View Early Access
The ability to debug low-level machine instructions has been added to TotalView 2023.4. The new Assembly View displays machine instructions for the current function in PC scope. Instruction level stepping commands enable fine-grained control stepping across machine instructions. Instruction level breakpoints allow precise program execution control and enable debugging tough situations where it is important to understand individual program instructions and data move operations. To display the Assembler View right click in the source area and select Show Assembler.
New C++ Type Transformations
TotalView 2023.4 adds additional type transformation support for the following C++ collection classes and iterators for traversing through the data elements on the collections.
- deque
- forward_list
- list
- queue
- priority_queue
- stack
- array
- pair
- tuple
CUDA 12 Support
TotalView 2023.4 adds support for CUDA 12. See the release notes for full details and recommended configurations to successfully debug on CUDA 12 systems with TotalView.
Bug Fixes and Performance Improvements
Numerous bug fixes and performance improvements have been addressed with TotalView 2023.4
View Full Release Notes
For more details, please refer to the TotalView release notes, where you can see more details and specs on how to enable various features, what to expect from updates, and info about any features on hold.
TotalView 2023.3
Array Slicing and Striding
TotalView 2023.3 adds the ability to define a slice and stride for arrays in the Array View. Simply click on the configuration icon in the Array View toolbar to display the Array Configuration Options dialog.

Define the start and end dimensions for the array and an optional stride for the data in the dialog.
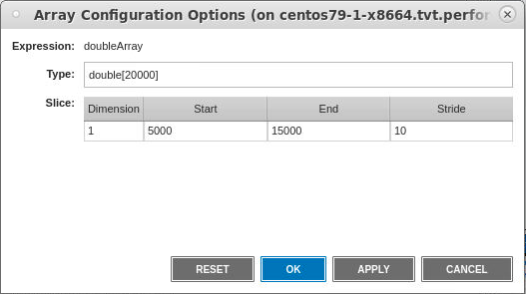
Use the apply button to live update the display in the Array View or Ok to close the dialog and use the defined settings. The type of the array can also be changed through the Options dialog.
Memory Debugging Block Overwrite / Guard Block Report
Building on the memory block overwrite detection capabilities added in TotalView 2022.2, version 2023.3 adds the ability to generate an on-demand Corrupt Guard Block Report that lists all memory blocks that have had their bounds overwritten.
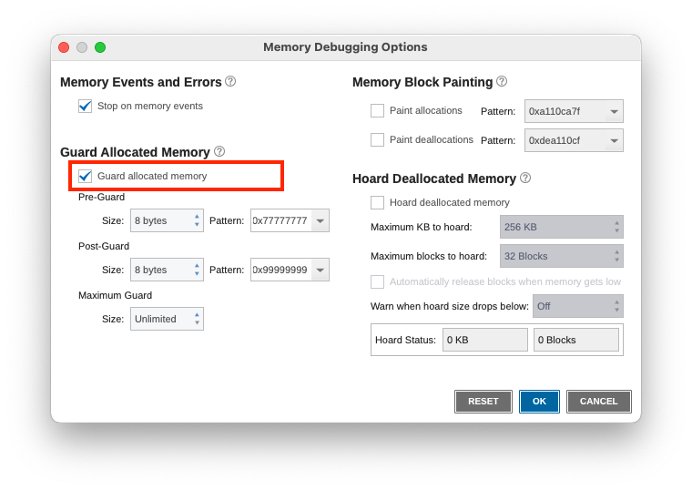
TotalView detects memory block overwrites by padding a pattern filled guard block on either side of the allocated memory block. If the pattern is disturbed an overwrite has occurred. To turn on overwrite detection, open the Memory Debugging Options dialog, and toggle the Guard allocated memory checkbox.
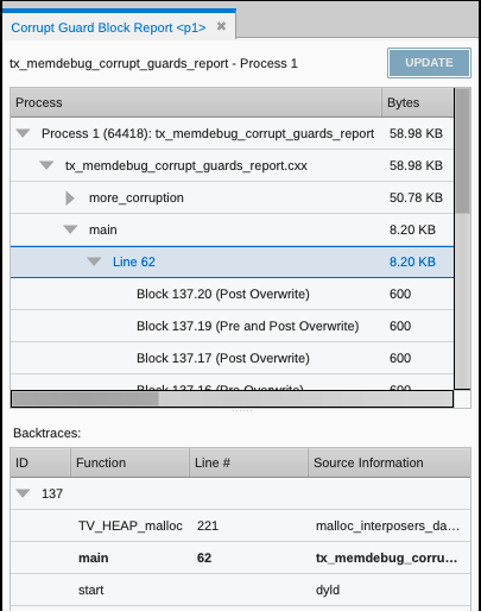
At any point during program execution, all allocated memory blocks can be checked for overwrites by opening the Corrupt Guard Block Report. This is easily done by pressing the icon in the Memory toolbar or selecting Debug > Corrupt Memory Block Report from the main menu.
The Corrupt Guard Block Report shows all the memory blocks found with overwrite violations. Locations are broken down by process, file, function, line number, and the list of individual blocks that have been overwritten. TotalView also reports if the block was overwritten at the start (pre) or end (post) of the block.
Python 3.11 Debugging Support
Debugging Python 3.11 applications along with C/C++ Python modules is supported in the TotalView 2023.3 release. Python 3.11 significantly changed how the debug and program information was stored. TotalView has been updated to find the proper information and provide a unified Python and C/C++ debugging view of the mixed language debugging session.
Apple M1/M2 Debugging Support
TotalView 2023.3 adds platform support for Apple’s ARM based M1 and M2 architectures. Only debugging with TotalView’s new UI and CLI are supported. Both macOS Monterey and Ventura are supported on M1/M2 based systems.
Preliminary CUDA 12 Support
TotalView 2023.3 adds preliminary support for CUDA 12. See the CUDA specific platform notes later in this document for full details and recommended configurations to successfully debug on CUDA 12 systems with TotalView.
Bug Fixes and Performance Improvements
Numerous bug fixes and performance improvements have been addressed, including performance improvements for data transformations.
View Full Release Notes
For more details, please refer to the TotalView release notes, where you can see more details and specs on how to enable various features, what to expect from updates, and info about any features on hold.
TotalView 2023.2
Visualize Array Data with 3D Surface Plots
TotalView’s data visualization capabilities have been enhanced in the 2023.2 release with the ability to visualize array data with a new 3D surface plot. To view array data with the surface plot, first select Add to Array View from the context menu of a data element in the Data Window.
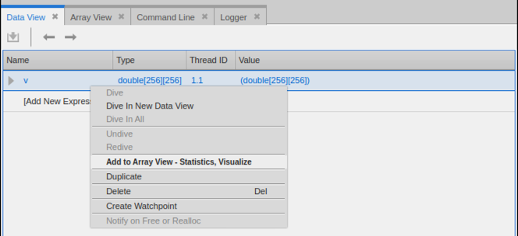
Figure 1 - Add array data to the Array View
Once the Array View is displayed, select the Surface Plot button, to visually examine the array data. The data displayed can be sliced by changing the variable expression. In the following screenshot all the data is displayed using expression v[:][:]. To display a subset of the data the expression could be altered to something like v[10:30][20:40]. Utilize the plot controls to rotate and zoom the display.
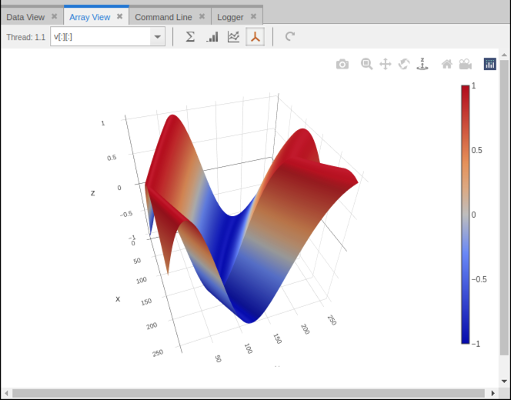
Figure 2 - Array View Surface Plot
Surface plot display is only supported on the Linux-x86-64, Linux ARM64, and macOS platforms and requires OpenGL version 2.1 or greater. See the OpenGL Support release notes for the Linux and macOS platform below for more details.
TotalView UI Share Group Target Support
For TotalView2023.2, the debugger’s underlying ability to target a Share Group for various debugger operations has been added to the UI. As TotalView acquires processes into its debugging session it organizes them into a Control Group and Share Group based on how they were launched and their executable image. All processes launched from a common starter process, such as MPI’s mpirun, will be placed in the same Control Group. Processes sharing a similar executable image are organized into a common Share Group. For example, a Multi-Program/Multi-Data (MPMD) style application will utilize multiple executable images. As processes of these images are started, they are placed in their own Share Groups. A Share Group of processes can then be targeted for specific debugging operations such as stepping. Allowing you to just step just the process in the Share Group. See the TotalView User Guide for more details on using Share Groups during your debugging sessions.
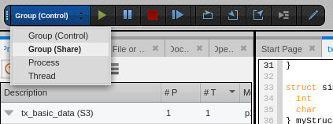
Figure 3 - TotalView Group (Share) Control Menu Item
Memory Buffer Overwrite Detection
TotalView 2023.2 adds the ability to detect when an allocated memory block has been overwritten beyond the ends of its bounds using guard block technology. To enable buffer overwrite detection simply turn on the “Guard allocated memory” option from the Memory Debugging Options dialog box from the TotalView toolbar or Debug menu.
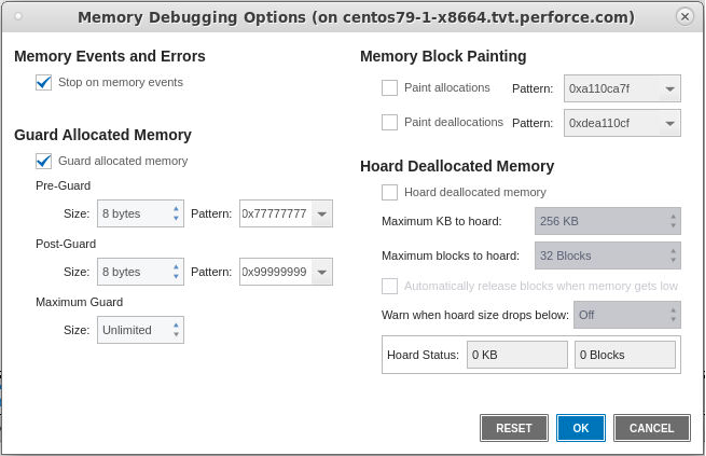
Figure 4 - Watch Buffer Overwrites by Guarding Allocated Memory
Once enabled, TotalView will verify memory block bounds have not been overwritten when they are freed and raise a memory event if any violations are found. The next version of TotalView will provide a guard block check report to verify all memory blocks at any time during a debugging session.
Advanced Memory Debugging with Hoarding
The ability to “hoard” deallocated memory blocks have been added to TotalView 2023.2. Hoarding is useful when analyzing dangling pointer bugs. When a hoarding is turned on blocks being freed are not actually freed with the operating system but instead are “held aside” by TotalView’s memory debugging technology. This allows the contents for the memory block to remain stable since it will not be reissued as new memory is allocated. Keeping the memory contents stable eliminates sporadic failures due to inconsistent memory contents and allows the developer to continue to diagnose a dangling pointer situation. Hoarding is often combined with memory debugging painting which paints a pattern to newly allocated and deallocated memory. Painting a pattern into memory creates consistent data in the memory blocks to more easily identify read before initialize and read after free issues.
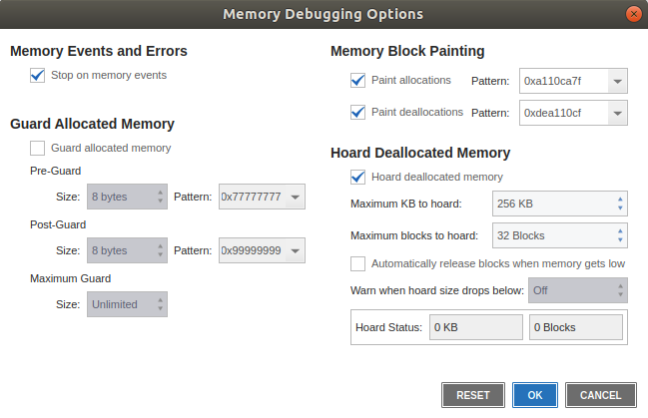
Figure 5 - Painting and Hoarding Memory Debugging Options
Upcoming macOS M1/M2 Support
TotalView 2023.2 adds support for macOS Ventura but only for the Apple Intel architecture. Active development to support Apple’s ARM based M1 and M2 chipset is underway. An early access beta of the upcoming TotalView 2023.3 release will be available this summer. If you are interested in participating in the beta, please send a note to the TotalView support team at techsupport@roguewave.com. We’ll reach out once the beta is available!
Bug Fixes and Performance Improvements
Numerous bug fixes and performance improvements have been addressed, including performance improvements for data transformations.
View Full Release Notes
For more details, please refer to the TotalView release notes, where you can see more details and specs on how to enable various features, what to expect from updates, and info about any features on hold.
TotalView 2023.1
TotalView Performance Enhancements
For TotalView 2023.1, user interface updates and debug event processing have been optimized, resulting in faster debugging session launches, especially for large scale parallel jobs. These changes will also improve user interface updates during debugging operations, such as when quickly stepping through multiple lines of source code.
CUDA 11.8 Support
TotalView 2023.1 adds support for debugging applications using CUDA 11.8 SDK using the legacy CUDA debugger backend. CUDA 11.8 introduced a new unified CUDA debugger backend, but several serious problems were identified while testing TotalView against the new implementation. The only viable workaround is to force CUDA to fall back to the legacy CUDA debug implementation by setting the CUDBG_USE_LEGACY_DEBUGGER environment variable to 1, e.g., export CUDBG_USE_LEGACY_DEBUGGER=1. The CUDA 12.0 r525 driver release should address the issues so that the new unified CUDA debugger backend will work correctly with TotalView. Note, because every debugger process andapplication process in the debug session must use the same setting, we recommend that the environment variable be set in your shell startup file (e.g., .cshrc or .bashrc), which is the simplest way to satisfy this requirement.
TotalView AMD GPU ROCm Initialization and ROCm Support Update
For the 2023.1 release, TotalView automatically discovers if the target program is utilizing the ROCm toolkit for running code on AMD GPUs. As a result, developers no longer need to add the -rocm command line switch to turn on AMD GPU debugging. This version of TotalView also supports ROCm 5.4.
Memory Debugging Painting
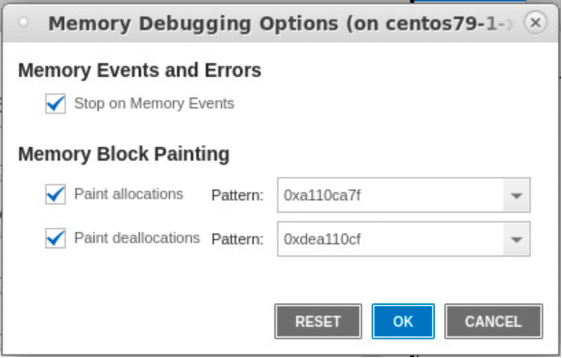
Finding memory access problems for uninitialized memory or when memory has been freed is a real challenge often resulting in a lot of time debugging sporadic data issues and crashes. To make it more predictable in finding these issues, TotalView 2023.1 adds the ability to turn on memory painting for newly allocated memory blocks and freed memory blocks. In either case, a hexadecimal paint pattern is written into the memory block giving you a consistent memory value for cases when your program tries to read from the memory blocks. Turn on painting by simply checking the option in the Session dialog from the Start Page.
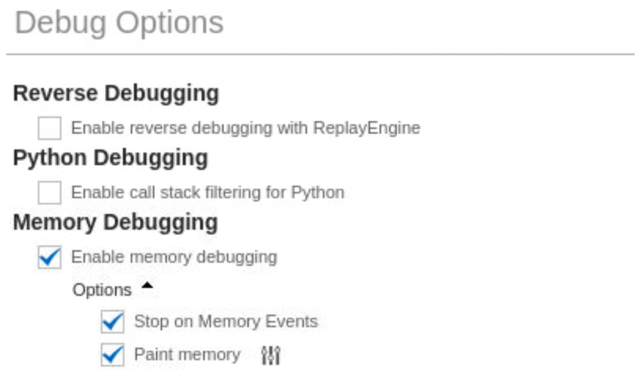
Optionally, enable the option within the memory options dialog from the memory debugging toolbar.
TotalView Working Directory
Users can now specify a working directory where TotalView will executing your target program. If not provided, the default is the directory from which you invoked TotalView.
This value can be entered into the UI or on the command line when starting TotalView. It can then be modified during a debug session using the Process > Modify Arguments menu or simply as part of setting up a new debugging session.

Specify the working directory from the command line using the new -working_directory command line argument:
totalview -working_directory /tmp Python 3.10 Mixed Language Debugging Support
TotalView 2023.1 adds support for Python 3.10 when performing mixed language C/C++ and Python debugging.
AIX 7.2 Support
TotalView 2023.1 adds support for AIX 7.2. In our testing though we found that targets launched through a fork/exec on AIX 7.2 occasionally hang in low-level ptrace() system calls as TotalView tries to write to the target processes address space. This has been traced to a kernel bug in the underlying AIX operating system. This issue has been fixed by IBM and is will soon be available in a software fix from IBM.
Bug Fixes and Performance Improvements
Numerous bug fixes and performance improvements have been addressed, including performance improvements for data transformations.
View Full Release Notes
For more details, please refer to the TotalView release notes, where you can see more details and specs on how to enable various features, what to expect from updates, and info about any features on hold.
TotalView 2022.4
AMD GPU Debugging Support
TotalView 2022.4 adds support for debugging AMD GPUs in addition to its ability to debug NVIDIA GPUs. TotalView supports versions 5.1 to 5.2 of the ROCm software stack for GPU programming, including support for debugging HIP (Heterogeneous Interface for Portability) and MPI code running on AMD MI50, MI100, and MI200 series of GPUs. TotalView supports the following debugging features on AMD GPUs:
- Process launch, attach, and detach
- Viewing scalar, vector, general, and special AMD GPU registers
- Instruction disassembly
- Breakpoint creation and deletion on AMD GPU code
- Single-stepping and fast smart-stepping
- Stack unwinding, including inlined functions
- Navigation controls for changing the logical workgroup / work-item focus or physical agent, queue, dispatch, wave, and lane focus
- Variable display with the ROCm 5.1+ compilers
- Data watchpoints on global memory variables
Preparing your program for debugging is simple. Use the “-O0 -g” flags with the ROCm 5.1+ compilers to generate the necessary debug symbols for TotalView.
To debug a program on AMD GPUs, use the “-rocm” flag when you start TotalView, for example:
totalview -rocm a.out
Once started, simply set breakpoints in the HIP kernel code by selecting the line number where you would like to stop, then begin running your program. TotalView will automatically plant breakpoints in the HIP code once it is loaded onto the GPU. Use TotalView’s stepping commands to control execution, and dive on variables to view their values in your GPU code. Reverse debugging will not be supported for code running on the AMD GPUs but is planned to work with reverse debug code running on the CPU in a combined CPU/GPU debugging session. There currently is an issue while reverse debugging when the -rocm switch is used and debugging on the GPU. We are working to resolve this issue for an upcoming release of TotalView.
To learn more about specific AMD GPU debugging characteristics, see help for the drocm command in TotalView’s Command Line Interface (dhelp drocm).
Array View for Array Debugging and Visualization
A new Array View is available in TotalView 2022.4 which enables focused debugging of array data. Through the Array View, you can examine statistical information about an array and visualize array data.
To bring up the Array View, either activate it from the Window > Views > Array View menu item or select Add to Array View from the context menu in the Local Variables view or Data View when selecting an array variable.
Figure 1 - Add to Array View menu item
The toolbar area of the Array View displays the process and thread for the array data being displayed. The array expression is shown along with the slice of the array to debug. In Figure 2, array expression floatArray[:] is shown and the [:] specifies to debug the whole array. A portion of the array can be specified by providing the beginning and ending indices, such as [10:15].
The Array View displays array statistics information initially. In previous versions of TotalView this was separate functionality available in the Array Statistics View.
Figure 2 - Array Statistics
A histogram plot of the array data is shown when the bar plot icon is clicked in the toolbar. Adjust the number of bins used in the plot using the field in the plot.
Figure 3 - Visualize Array in Histogram Plot
A line plot of the array data is also available when the line plot icon is selected in the toolbar.
Figure 4 - Visualize Array in Line Plot
Watch for more array debugging capabilities to be added to the Array View in coming versions of TotalView!
TotalView Startup Performance Enhancements
For TotalView 2022.4, further startup performance improvements optimize how the debugger looks up symbols and entry point values in the runtime linker. This can have a big impact on debugger startup performance for applications built with many shared libraries.
DEBUGGING TIP: A further startup performance optimization customers should consider using is to instruct TotalView to defer processing of shared libraries until later in the debug session. By adding the TotalView command line option -no_dlopen_always_recalculate the debugger will delay processing shared library symbols until they are needed later in the debug session. Learn more about tuning TotalView’s parallel debugging performance in the “Scalability in HPC Computing Environments” section of the TotalView User Guide, Part III Parallel Debugging chapter.
TotalView Base Compilation System and Dependency Changes
TotalView 2022.4 changes the base compilation for the following systems:
Linux x86-64
- Base build system was changed from CentOS 7.0 to CentOS 7.9, resulting in a base OS of CentOS/RHEL 7.9 and above. Ubuntu 18.04 and 20.04 are also supported.
Note that TotalView’s user interface requires have libxkbcommon and libXcomposite libraries, typically installed as part of a desktop graphical environment.
Linux PowerLE
- Base build system was changed from Ubuntu 14.04 to CentOS 7.5. The new base supported system changes to CentOS/RHEL 7.5 and above. Ubuntu 18.04 and 20.04 are also supported.
Note that TotalView’s user interface requires have libxkbcommon and libXcomposite libraries, typically installed as part of a desktop graphical environment.
macOS
- Base build system was changed from macOS High Sierra to macOS Big Sur. TotalView’s base compilation support stays the same with support for macOS Big Sur and Monterey.
Bug Fixes and Performance Improvements
Numerous bug fixes and performance improvements have been addressed, including performance improvements for data transformations.
View Full Release Notes
For more details please refer to the TotalView release notes, where you can see more details and specs on how to enable various features, what to expect from updates, and info about any features on hold.
TotalView 2022.3
AMD GPU Debugging Preliminary Support
TotalView 2022.3 expands its GPU debugging capabilities with support for debugging AMD GPUs, in addition to its ability to debug NVIDIA GPUs. TotalView supports versions 5.1 and 5.2 of the ROCm software stack for GPU programming, including support for debugging HIP (Heterogeneous Interface for Portability) and MPI code running on AMD MI50, MI100, and MI200 series of GPUs. With this release, TotalView supports the following debugging features on AMD GPUs:
- Process launch, attach, and detach
- Viewing scalar, vector, general, and special AMD GPU registers
- Instruction disassembly
- Breakpoint creation and deletion on AMD GPU code
- Single-stepping and fast smart-stepping
- Stack unwinding, including inlined functions
- Navigation controls for changing the logical workgroup / work-item focus or physical agent, queue, dispatch, wave, and lane focus
- Variable display with the ROCm 5.1+ compilers
- Data watchpoints on global memory variables
Preparing your program for debugging is simple. Use the “-O0 -g” flags with the ROCm 5.1+ compilers to generate the necessary debug symbols for TotalView.
To debug a program on AMD GPUs, use the “-rocm” flag when you start TotalView, for example:
totalview -rocm a.out Once started, simply set breakpoints in the HIP kernel code by selecting the line number where you would like to stop, then begin running your program. TotalView will automatically plant breakpoints in the HIP code once it is loaded onto the GPU. Use TotalView’s stepping commands to control execution, and dive on variables to view their values in your GPU code. Reverse debugging will not be supported for code running on the AMD GPUs but is planned to work with reverse debug code running on the CPU in a combined CPU/GPU debugging session. There currently is an issue while reverse debugging when the -rocm switch is used and debugging on the GPU. We are working to resolve this issue for the next release of TotalView.
To learn more about specific AMD GPU debugging characteristics, see help for the drocm command in TotalView’s Command Line Interface (dhelp drocm).
Watch for more AMD GPU debugging features in our 2022.4 release in November, including watchpoint support! If you are attending Supercomputing 2022 this year, make sure to attend the “Debugging the Toughest Challenges with NVIDIA and AMD GPUs” Exhibitor Forum talk for more details about debugging AMD and NVIDIA GPUs with TotalView.
Dive Stack Expansion State
TotalView 2022.3 expands on the Dive Stack functionality introduced in version 2022.2. The Dive Stack enables developers to easily explore data by traversing/diving into data structures and back out. Version 2022.3 adds functionality to maintain the expansion and scroll state before the dive so that an undive operation restores the Data View as it was.
NVIDIA OpenACC Support
TotalView 2022.3 adds official support for debugging NVIDIA OpenACC compiled applications.
Bug Fixes and Performance Improvements
Numerous bug fixes and performance improvements have been addressed, including performance improvements for data transformations.
View Full Release Notes
For more details please refer to the TotalView release notes, where you can see more details and specs on how to enable various features, what to expect from updates, and info about any features on hold.
Watch the What's New Webinar
Bill Burns, Senior Director of Product Engineering will show you all the new features. Watch now >>
TotalView 2022.2
Data Debugging Workflow Improvements With Dive Stacks
The latest release incorporates a popular feature from TotalView’s Classic UI, allowing users to navigate a Dive Stack of expressions when using data structures in Data View. Navigating up and down the stack allows you to move more easily through the data and streamlines workflows.
Fedora 35 and Ubuntu 22.04 Preliminary Support
There have been many Fedora 35 and Ubuntu 22.04 system level changes that impact debuggers. Our latest release offers enhancements and fixes to support debugging on these platforms. Testing for full support in the 2022.3 release is ongoing.
Solaris Base System Change and Query About System Support
Due to infrastructure changes, we’ve moved from Solaris 11u3 to 11u4. We are interested in hearing if customers still actively use Solaris for development and debugging. Please send an email to Bill Burns, TotalView product manager, at bburns@perforce.com if Solaris is still an important platform for you.
TotalView CLI dprint Command Timeout Option
The latest release supports the ability to define a timeout via CLI dprint commands. Simply add “-timeout nSeconds” to define the number of maximum number of seconds the command should run.
TotalView's Security Updates
TotalView 2022.2 upgrades its use of zlib to the latest version to eliminate a CVE security vulnerability.
TotalView Startup Performance Improvements
TotalView’s processing of debug symbols during startup have resulted in a 42x performance improvement and reduced processing time from minutes to seconds, in one use case, as compared to the 2021.4 version. In cases where an executable or shared library contains thousands of subroutines, this new processing logic greatly improves efficiency.
Utilize Library Build ID's to Improve TotalView Processing Performance
TotalView 2022.2 incorporates advancements to processing of libraries in parallel jobs. Checksums are used to find similar libraries loaded by parallel processes across a cluster of nodes to determine which libraries are identical. Checksumming can incur a performance penalty as each library is checked. TotalView 2022.2 attempts to extract the Build ID from shared library image files, thereby improving overall processing.
New User Interface Improvements
TotalView’s new user interface is available by default for new users and is activated through the Display Preferences panel or using the -newUI command line option for existing TotalView users.
Share Your Feedback
If you have any feedback about new features, wish to make requests for new or missing features, or want to report any problems please send an email to tv-beta@perforce.com.
View Full Release Notes
For more details please refer to the TotalView release notes, where you can see more details and specs on how to enable various features, what to expect from updates, and info about any features on hold.
TotalView 2022.1
Memory Debugging Block Notify
A particularly challenging memory debugging situation occurs when a specific memory block is free but a program accesses the memory later through a dangling pointer reference. Because the memory may or may not still contain valid data, sporadic crashes and data problems can occur. TotalView 2022.1 adds the ability to watch a specific allocated memory block and raise an event when it gets freed or deleted, effectively mitigating this debugging challenge.
MacOS Monterey Support
TotalView 2022.1 adds support for Apple’s latest version of macOS 12 Monterey.
CUDA 11.4 and 11.5 Support
TotalView 2022.1 adds official debugging support for CUDA 11.4 and 11.5.
Bug Fixes and Performance Improvements
Numerous bug fixes and performance improvements have been made to TotalView. See the release notes for the full list of bug fixes.
Share Your Feedback
If you have any feedback about new features, wish to make requests for new or missing features, or want to report any problems please send an email to tv-beta@perforce.com.
View Full Release Notes
For more details please refer to the TotalView release notes, where you can see more details and specs on how to enable various features, what to expect from updates, and info about any features on hold.
Watch the What's New Webinar
Bill Burns, Senior Director of Product Engineering will show you all the new features. Watch now >>