Top 5 Reasons HPC Computing Developers Use TotalView for Debugging Code
TotalView is a high-performance debugging tool for Linux, UNIX, and macOS platforms. It provides debugging support for multi-threaded, multi-process applications, and GPU accelerators. TotalView provides an easy-to-use interface that supports local as well as remote debugging. Let’s learn about the top reasons why HPC computing developers rely on TotalView to solve some of the toughest problems in their complex applications.
Support for HPC Technologies
Today’s HPC applications leverage various technologies to enable them to parallelize their code for maximum compute throughput. TotalView supports these technologies so that it can provide comprehensive debugging capabilities for finding and solving tough bugs in your parallel applications.
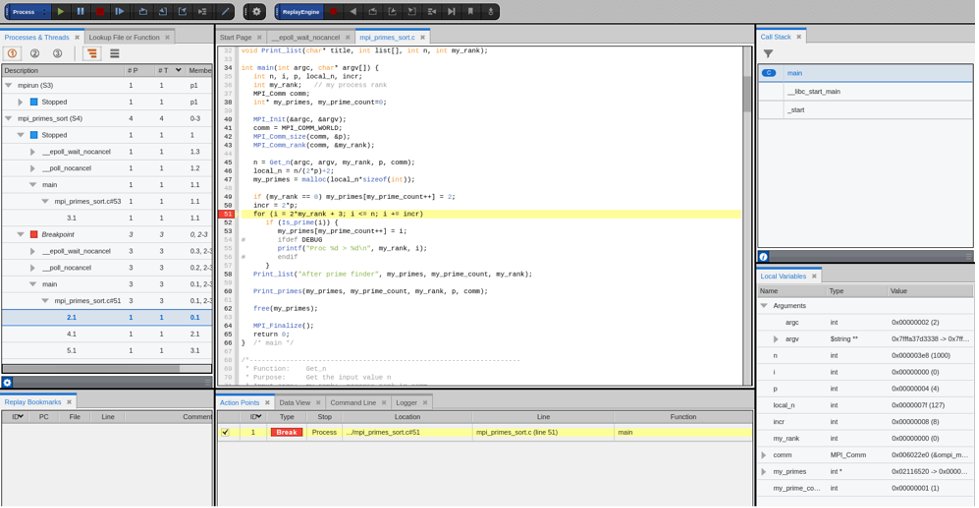
Beginning with the launch of a parallel application using a workload manager such as SLURM, TotalView will follow the launch and accumulate the processes into its debugging session. Using advanced reverse connect technology, TotalView easily allows developers to connect a waiting TotalView user interface with their application once it is launched into a cluster.
With the parallel application under TotalView’s control, developers can begin setting breakpoints, running their program, and debugging through their control to understand its execution and find failures. Parallel applications utilize the Message Passing Interface (MPI) to communicate between the running processes, or ranks. TotalView “understands” MPI’s APIs, how communication is done, and provides the capabilities to examine message queues, individual messages, and find any problems between communicating processes.
To parallelize an application on a supercomputer node, applications will leverage Open Multi-Processing (OpenMP) to perform shared-memory multiprocessing and run multiple threads of execution on the CPU. TotalView leverages the OpenMP Debugging interface to understand the internal data structures and information about OpenMP threads, tasks, and regions used to perform parallel tasks. Using this information TotalView provides a developer-oriented view of the state and relationships of OpenMP tasks and regions including connecting call stacks to show how one task launched another task.
Finally, HPC computing applications make use of GPU accelerators from NVIDIA or AMD to further maximize compute capabilities. Debugging applications utilizing GPUs can be a challenge due to the complexities of the interaction of code running on CPUs and GPUs and how code runs on the GPU. TotalView fully supports debugging CUDA code running on NVIDA GPUs and HIP code running on AMD GPUs. Developers can easily set breakpoints, examine variable data on the GPU, and understand how their code is running across all the threads of a GPU.
Back to topScalability, Complexity, and Insight
HPC applications are complex and push the limits of scale through the number of shared libraries used to construct them, the number of processes launched across a cluster, the number of threads within each process, and the use of advanced GPU accelerators. TotalView was built to deal with scale, parallelism, and complexity. Parallel concepts are baked into common debugger operations allowing developers to easily set breakpoints across thousands of processes and quickly step them through code. At any point, developers can view data across a group of processes or threads.
Through advanced use of aggregation TotalView provides a concise view into the state of processes and threads being debugged. Allowing the developer to quickly hone into their application and examine what might be wrong.
Back to topAdvanced Debugging Technologies
Providing parallel debugging capabilities is important for developers to efficiently debug their HPC computing applications but tough bugs can be resolved much faster by making use of TotalView’s advanced debugging features.
Advanced Language Support:
Most HPC computing applications are written in C, C++, or Fortran. TotalView provides advanced support for each of the languages from understanding language constructs and types to easily allowing developers to examine application data including advanced array debugging and visualization.
Scalable Memory Debugging:
Many elusive bugs are due to mismanagement application memory and variables that reference it. HPC computing developers rely on TotalView’s advanced memory debugging capabilities to understand how their parallel application is utilizing memory, where it is leaking memory, and leverage powerful memory debugging techniques to paint and hoard memory to trace down dangling pointer references.
Reverse Debugging:
Really tough problems in code can require re-running the application many times while a developer narrows down what may have caused a crash or bad data result. TotalView’s advanced reverse debugging feature allows a developer to deterministically record the execution of their program and then run backwards to examine what went wrong, all within one debugging session! Reverse debugging saves developers a lot of time and allows them to quickly get to the root of the problem and come to a solution.
Mixed Language C/C++ and Python Debugging:
Use of Python in HPC continues to grow. Developers are leveraging Python to combine it with existing C and C++ applications. Python makes it very easy to call into a C or C++ compiled shared library module, but this scenario creates a complex situation for developers to debug as they trace program execution and data across the language boundaries. TotalView’s advanced language debugging capabilities enables developers to debug their Python and C/C++ code within one debugging session. With TotalView, developers see a clean integrated call stack between the languages, examine both Python and C and C++ data, and can utilize all TotalView’s advanced debugging capabilities to debug the C and C++ code.
Back to topEasy to use User Interface
HPC applications end up scaling to hundreds or thousands of processes and threads running across multiple nodes with multiple CPUs and GPUs. Large amounts of data are calculated and produced by the applications. TotalView’s easy to use interface provides the performance and features required to understand the state of the job, drill down from a high-level to individual threads, find logic errors as your application runs and identify problems in application data.
Back to top
TotalView Support Team and Training
TotalView is not just an application you download and then you are on your own to figure out how to use it. Quickly get your HPC computing developers up to speed debugging their applications with TotalView’s comprehensive training. Leverage the TotalView training team to customize what is covered and incorporate tips and instructions specific to your application and environment. Access TotalView’s experienced support team to quickly resolve any issues you may encounter with the debugger or just inquire about the best way to solve a problem with your code.
Back to topNext Steps
See how TotalView supports debugging for parallel programming by testing it yourself.
Back to top