How to Solve CUDA Programming Challenges With TotalView
CUDA introduces developers to a number of new concepts that are not encountered in serial or other parallel programming paradigms. Visibility into these elements is critical for troubleshooting and tuning applications that make use of CUDA. In this blog, we explore CUDA and how TotalView helps users deal with new CUDA-specific constructs.
What Is CUDA Programming?
Back to topCUDA is a parallel computing model created by NVIDIA. It is used for general computing on NVIDIA’s own graphics processing units (GPUs), accelerating the runtime performance of computationally intensive applications.
Challenges of CUDA
While the benefit of CUDA is clear—faster parallel programming—there are several challenges for high performance computing (HPC) applications using CUDA.
Lack of Abstraction
CUDA generally exposes quite a bit about the way that the hardware works to the programmer. In this regard, it is often compared to assembly language for parallel programming. Explicit concepts such as thread arrays, map directly to the way the hardware groups computational units and local memory.
The memory model requires explicit data movement between the host processor and the device. CUDA makes explicit use of a hierarchy of memory address spaces, each of which obeys different sharing rules. This is more low-level detail than the typical application or scientific programmer has to deal with when programming in C, C++, or Fortran. It also raises significant concerns with regard to portability and maintainability of code.
Data vs. Task Parallelism
The second challenge is that the programming model for CUDA is one of data parallelism rather than task parallelism. When divvying up work across the nodes of a cluster, HPC programmers are used to looking for and exploiting parallelism at a certain level. The amount of data to assign to each node depends on a number of factors including computational speed of the node, the available memory, the bandwidth and latency of the interconnect, and the frequency with which results need to be shared with other processes.
Since processors are fast and network bandwidth is relatively scarce, the balance is typically to put quite a bit of data on each compute node and to move data as infrequently as possible. CUDA invites the programmer to think about parallelism of a completely different order, encouraging the developer to break the problem apart into units that are much smaller. This is often many orders of magnitude more parallelism than was previously expressed in the code and requires reasoning somewhat differently about the computations themselves.
Data Movement and Multiple Address Spaces
NVIDIA GPUs are external accelerators attached to the host system via the PCI bus. Each GPU has both its own onboard memory and also features smaller bits of memory attached to each one of the compute elements. While there are now mechanisms to address regions of host memory from device kernels, such access is slower compared to accessing device memory.
CUDA programs therefore use a model in which code running on the host processor prepares and explicitly dispatches work to the GPU, pauses for the GPU to complete that work, then reads the resulting data back from the device. Both the units of code representing computational kernels and the associated data on which these computational kernels will execute are dispatched to the device. The data is moved, in whole or part, to the device over the PCI bus for execution. As results are produced, they need to be moved, just as explicitly, back from the device to the host computer’s main memory.
Understanding how Code is Running on the GPU
GPUs are complex in how they run code and manage data. Understanding how your code runs across cores, streaming multiprocessors (SMs) and how the tens to thousands of threads are organized into blocks, lanes, and warps can be confusing.
Related Reading: What Is GPU Computing?
Back to topTotalView For CUDA Programming
TotalView has provided CUDA debugging support for many years. The current version of TotalView builds on and extends the model of processes made up of threads to incorporate CUDA threads. There are two major differences: CUDA threads are heterogeneous and TotalView shows a representative CUDA thread from among all those created as part of running a routine on the GPU. The GPU thread is shown as part of the process alongside other CPU threads, including OpenMP threads. Threads created by OpenMP or threads in any single process share an executable image, a single memory address space, and other process level resources like file and network handles.
CUDA threads, on the other hand, execute a different image, on a set of GPU processors with a different instruction set, and in a completely distinct memory address space. Because of the large number of CUDA threads, and the fact that only a small number of this large set of logical threads are likely to actually be instantiated on the hardware at any given moment in time, the TotalView UI has been adapted to display the thread specific data from a user selectable representative CUDA device thread. CUDA is often heavily used in conjunction with distributed multi-process programming paradigms such as MPI.
As such, the CUDA support in TotalView is complimentary and additive with the MPI and OpenMP support in TotalView. Users debugging a hybridn MPI/OpenMP+CUDA job see the same view of all their MPI processes and OpenMP threads running across the cluster and when they focus on any individual process they can easily see both what is happening on the host processor and what is happening in the CUDA code running on GPU kernels.
To better understand the state of code running on one or more GPUs TotalView 2021.4 has added a new GPU Status View. This highly configurable view allows you to select various attributes to build an aggregated display of the devices, SMs, warps, and lanes of where your code is running on the GPU. Giving you a deeper understanding of how your code is utilizing the GPU.
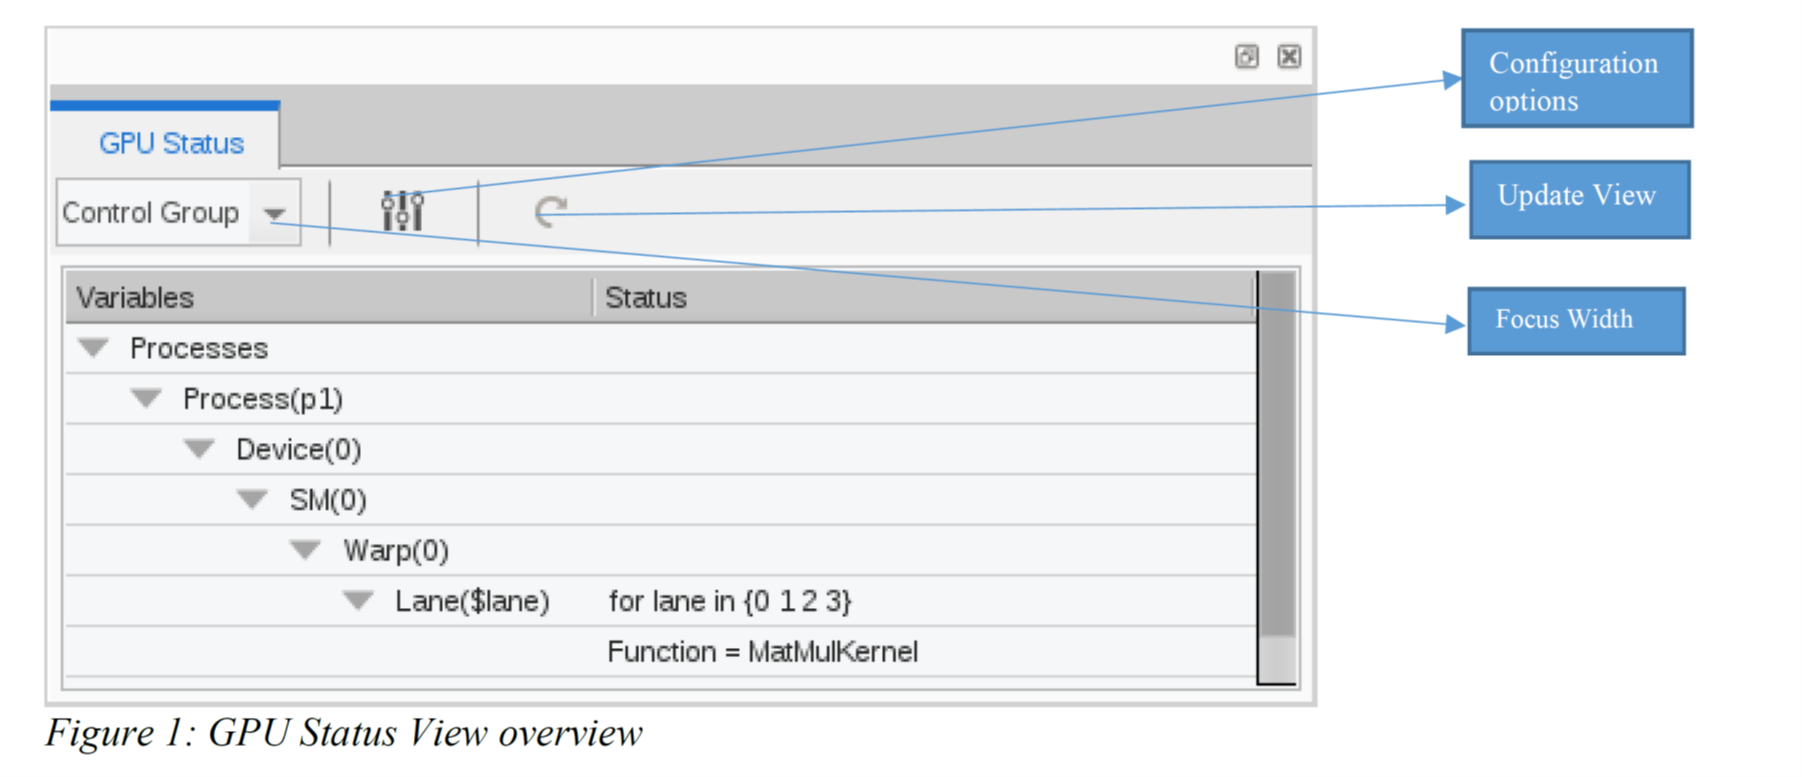
Figure 1 below shows the new GPU Status View displaying a simple case where all the GPU lanes are stopped at a breakpoint on device 0. The view contains a toolbar that provides three controls:
- Focus control that allows the user to select from a list of Focus widths. In Figure 1, the Focus width is set to be the “Control Group”.
- Configuration options button that will bring up a “Configuration” dialog box that provides numerous options and filtering capabilities for the view.
- Manual update button. The update button will show as orange if the data in the view becomes stale and needs to be refreshed. Selecting this button will refetch the GPU data and update the GPU Status View.
Focus Options
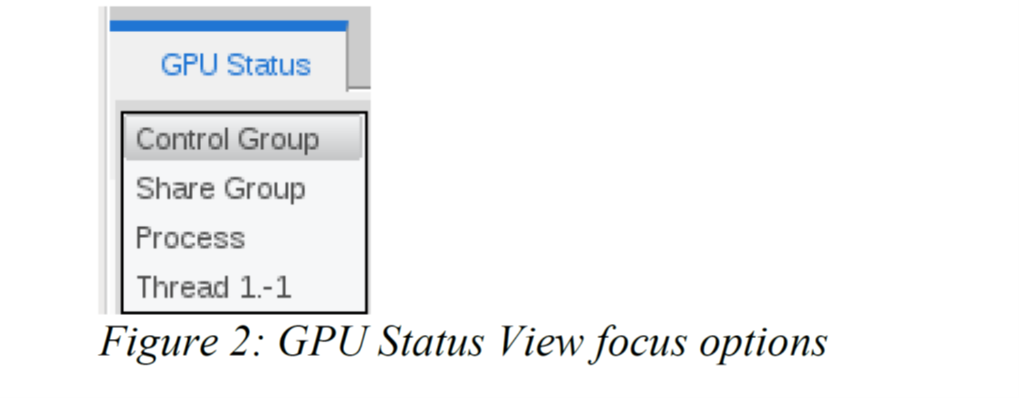
The Focus options that are available are shown in Figure 2 below. They include “Control Group”, “Share Group”, “Process” and a list of any CUDA context threads that are available in the process that is currently in focus in the UI. The focus width is based on the process that is currently in focus in the GUI. If the focus is set to be the “Share Group”, for example, it is the share group of the process that is in focus in the UI.
Configuration Options
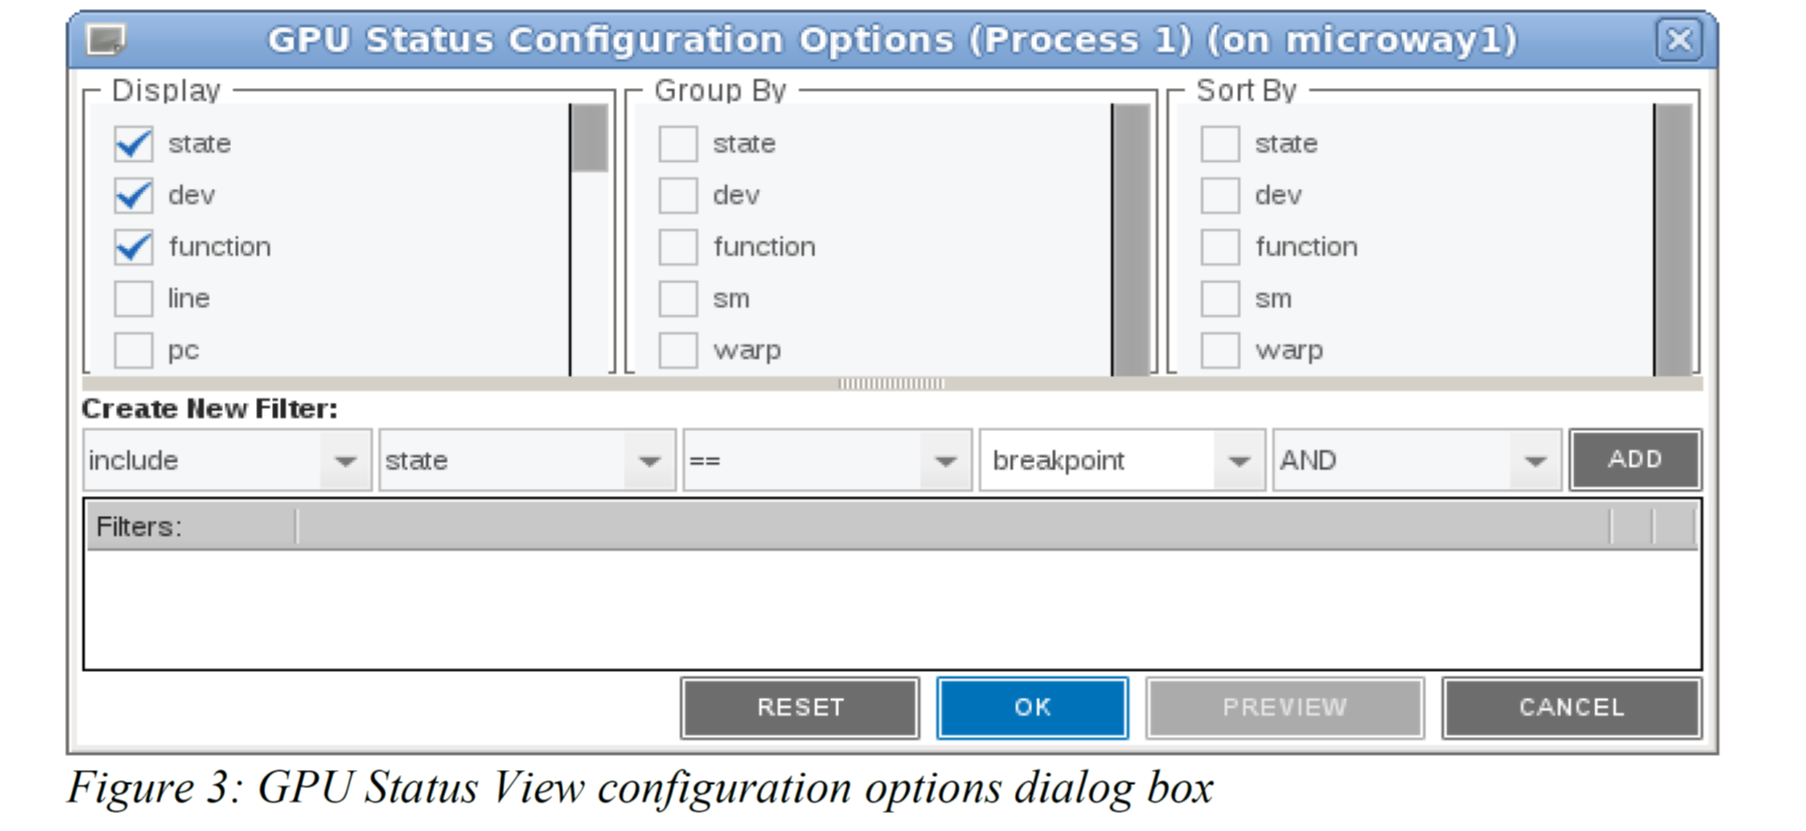
The GPU Status Configuration Options dialog box can be opened by clicking on the “Configuration Options” button in the GPU Status View toolbar. The dialog box is shown in Figure 3. The dialog box allows the user to select numerous state variables that can be displayed. There are some state variables selected by default. If a state variable is selected for “Display” it is also placed in the “Group By” and “Sort By” list. You can choose any of the state variables that are available in the Display column to “Group By” or “Sort By” to change how the table shows the aggregated results.
After making any changes to the configuration in the dialog box, such as choosing new state variables to either display, group by, or sort by, or after creating new filters, you can:
- Select the ‘OK’ button to save the configuration and close the dialog box.
- Select the ‘PREVIEW’ button to update the GPU Status View using the newly selected variables. The changes are saved only if ‘OK’ is selected.
- Select the ‘RESET’ button to restore the original settings prior to making any changes.
- Select the ‘CANCEL’ button to discard any changes and close the dialog box.
Filter Options
Filters can be created in the GPU Status Configuration Options dialog that provide the ability to “include” or “exclude” certain state variable values. The first combo box in the Configuration dialog allows the user to choose between “include” or “exclude” for the filter.
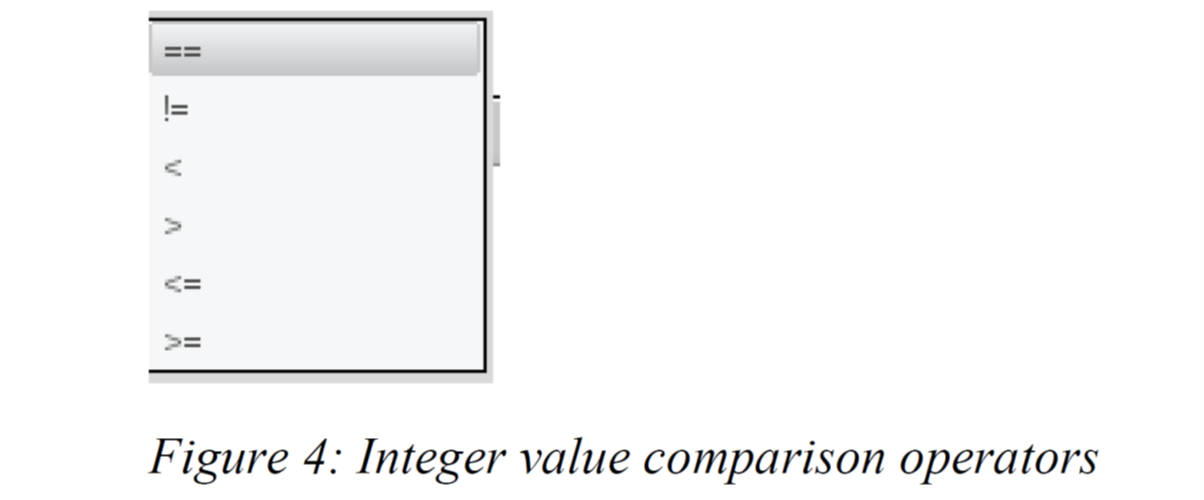
The second box will drop down showing all the available state variables. Depending on the state variable chosen, the third box will show varying comparison operators. If the state variable is a string value, the drop down will show only “==” and “!=”. However, if it is an integer value, the drop down will look like Figure 4 below.
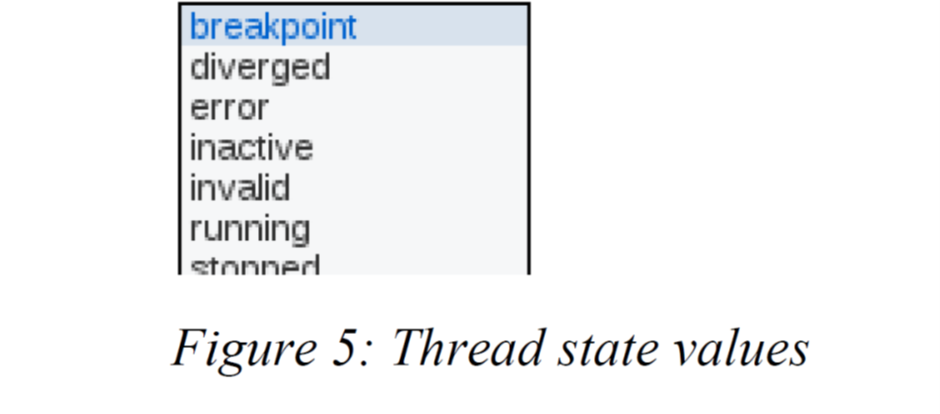
The third combo box will be an empty editable box if the value is a character string. However, in cases where we know the fixed set of valid values (such as the ‘thread state’) we will populate the drop down with the list of valid values like Figure 5 below.
Related reading:CUDA Debugging Support For Apps Using NVIDIA GPUs on ARM64
Back to topConclusion
We’ve covered how the TotalView process and thread model has been extended to allow users to easily switch back and forth between what is happening on the host processors, where MPI-level communication occurs and the program sets the stage for the data parallel work to happen on the GPU.
For an in-depth look at how TotalView addresses additional challenges presented by CUDA, download our white paper, Debugging CUDA-Accelerated Parallel Applications.
Back to top