Using OpenMP Debugging Interface (OMPD) With TotalView
Debugging HPC applications using MPI and OpenMP technologies can be a challenge. This blog provides a high level overview of OpenMP Debugging Interface (OMPD) with the TotalView debugger, and how this can be used in practice.
What Is OpenMP?
Back to topOpenMP (Open Multi-Processing) is an application programming interface (API) that supports multi-platform shared memory multiprocessing programming in C, C++, and Fortran, on most platforms, processor architectures and operating systems, including Solaris, AIX, HP-UX, Linux, OS X, and Windows. It consists of a set of compiler directives, library routines, and environment variables that influence run-time behavior. - Source
What Is OMPD (OpenMP Debugging Interface)
OMPD is an implementation-independent Application Programming Interface (API) that is intended to allow tools such as debuggers to inspect the internal execution state of OpenMP programs. Perforce contributed heavily to OMPD v5.0’s initial design and standardization process. The work involved close collaboration with several stakeholders, including Lawrence Livermore National Laboratory (LLNL) and members of academia.
The OMPD v5.0 API was added to the OpenMP 5.0 specification, published in November 2018, and is downloadable. The newest release of the OpenMP standard, version 5.1, continues to expand OpenMP’s capabilities with improvements in accelerator device interactions, filtering of execution by thread, improvements in modern C++ usage of OpenMP, Fortran improvements, and other enhancements.
What OMPD provides
The OpenMP Debugging API (introduced in OMPD v5.0) is an innovative interface that allows third-party tools, such as debuggers, to extract the execution state of an OpenMP (OMP) runtime library, including live processes and core files. OMPD allows the TotalView debugger, or other similar third-party tools, to extract information about OpenMP objects such as threads, parallel and task regions, internal control variables, parent/child thread relationships, and runtime call-stack boundaries.
Note: For examples referenced in this blog we've used TotalView 2020.3 and the LLVM Clang 12 compiler.
The OMPD Model
The model for OMPD deployment assumes that an OpenMP implementer will distribute a plugin library that a debugger can dynamically load to inspect the target’s OpenMP state. The expectation is that an OpenMP implementer will provide an OMPD plugin library that matches the OpenMP runtime used by the target process or device.
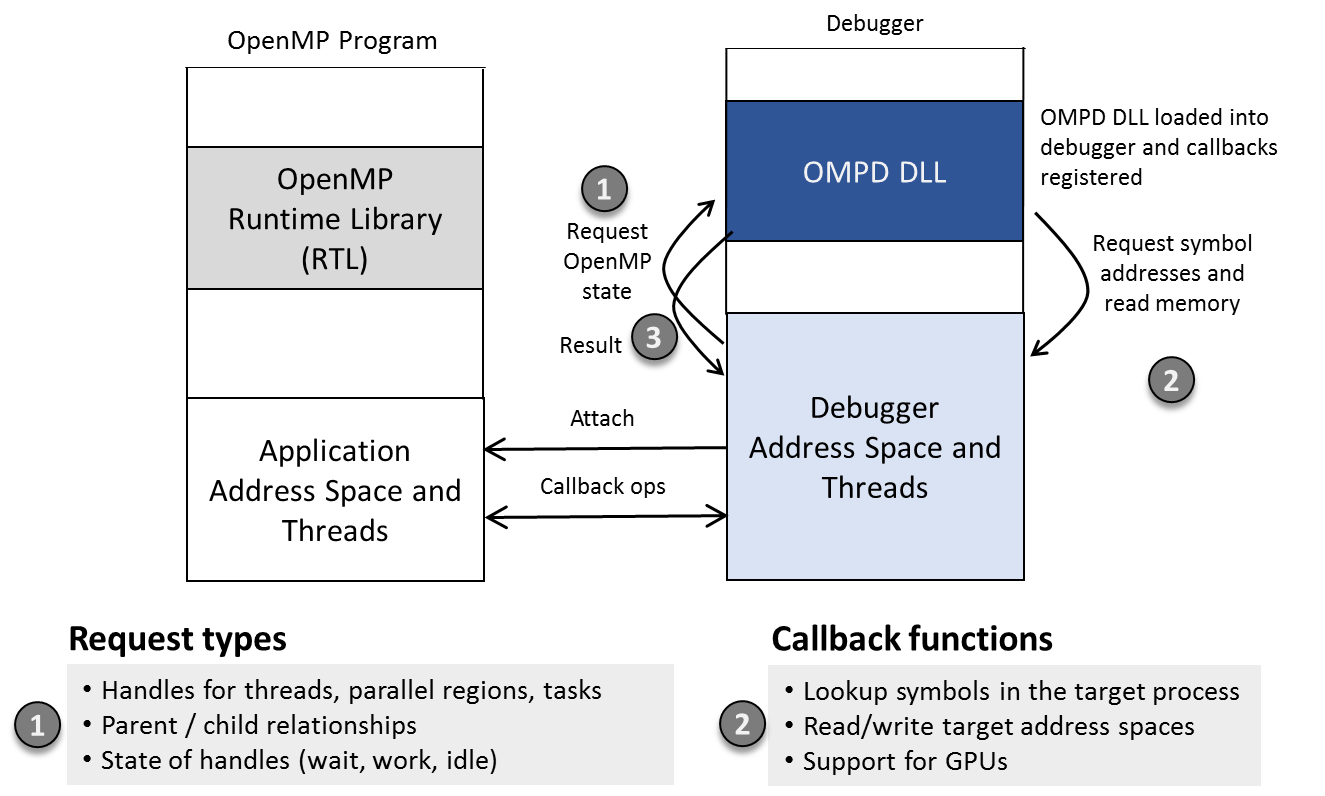
The diagram above shows the overall architectural layout of the debugger, OpenMP-enabled target application, and the matching OMPD DLL. The figure illustrates how a debugger might use OMPD to discover information about an OpenMP target.
The sequence begins with Step 1 in which the debugger invokes an operation in the OMPD API. Control passes to the code in the OMPD DLL plugin. Typically, the OMPD wants to read information out of the data structures maintained by the OpenMP runtime resident in the target. Since the OMPD and OpenMP runtime are matched, the OMPD knows how these data structures are laid out, and how to find them by symbol name.
In the diagram, we see in Step 2 the OMPD DLL calling back to the debugger to resolve the address of a symbol. Using this address, the OMPD can traverse the data structures in the target by invoking read callbacks to the debugger. A series of such lookups or reads may be needed to satisfy a single request from the debugger. Finally, once the OMPD has assembled the results, it returns them to the debugger in Step 3.
Back to topUsing OpenMP in TotalView
OpenMP View
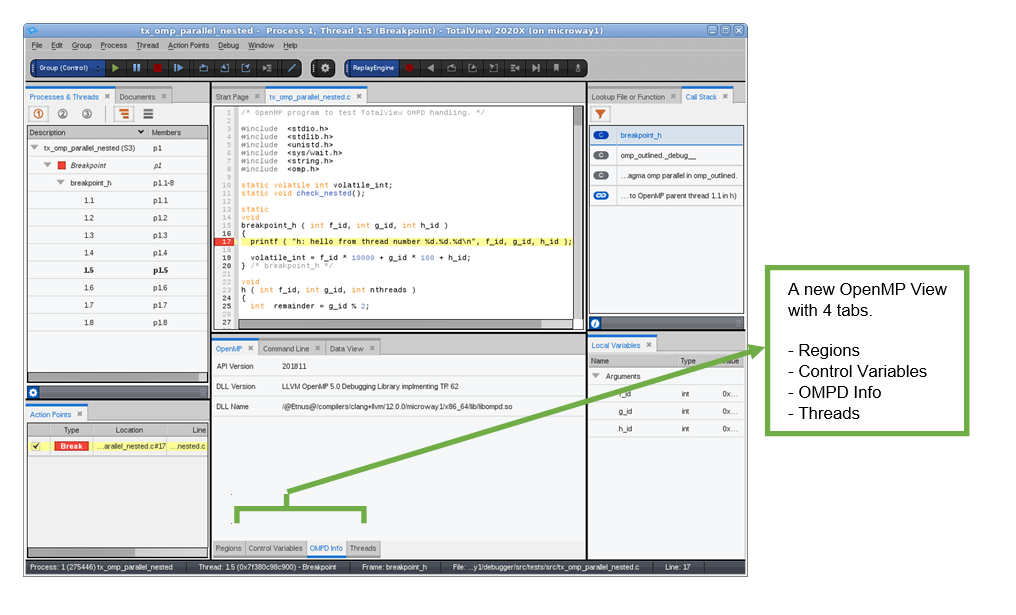
To support OMPD, displays were added in the TotalView new GUI and augmentation of stack frames in the CLI and classic GUI with #pragma information and link frames. A view named OpenMP is accessible in the new GUI and is used to display all the OMPD information provided through the OpenMP Debugging Interface. Similar information is also available through TotalView’s “domp” CLI command.
There are 4 tabs within the OpenMP View: OMPD Info, Control Variables, Regions, and Threads.
OPMD Info Tab
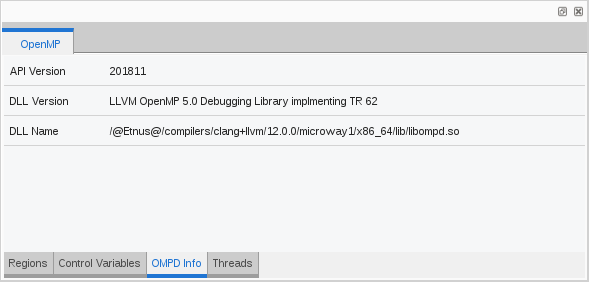
The OpenMP view displays information about the OMPD dynamic library (DLL) being used. This information is specific to the selected process. This tab contains the following values:
- API Version: The version of the OMPD API supported by the DLL, which is returned by ompd_get_api_version(). For OMPD v5.0, that value should be 201811.
- DLL Version: The string returned by ompd_get_version_string().
- DLL Name: The location of the OMPD DLL loaded by TotalView to handle that process. A specific DLL is loaded once into TotalView and then used for as many processes that specify it via the “ompd_dll_locations” variable in the process.The OpenMP View Control Variables Tab
Control Variables Tab

The Control Variables tab lists the settings of the OMPD display control variables for a selected process.
Regions Tab
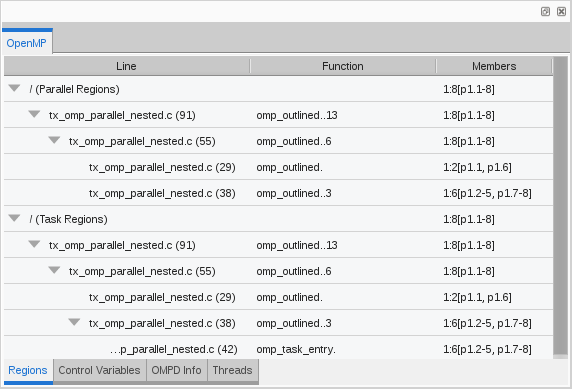
The Regions tab in the OpenMP view now shows information about the nest of parallel regions for the entire share group. Developers can select different regions in the display and TotalView will focus the source pane on the specific region.
Threads Tab
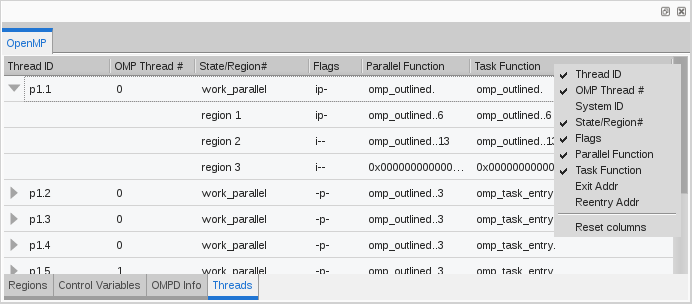
The OpenMP View Threads tab shows details about all the OpenMP threads in the application, information also available through the CLI’s “domp -threads” command. The “domp -threads” command has numerous options that are all included as columns within the Threads tab in a tree display.
The first line for a thread is for its current (innermost) region, which shows the basic OpenMP thread information. Each top level thread can be expanded to show information for the thread’s nest of parallel and task regions.
The expanded lines show the enclosing regions’ task flags and distance from the current region (as an integer in the state column Indicated by “Region #”), where the last line is for the outermost region. The regions may cross thread boundaries from a child thread to its parent thread.
OpenMP Stack Filtering in the GUI
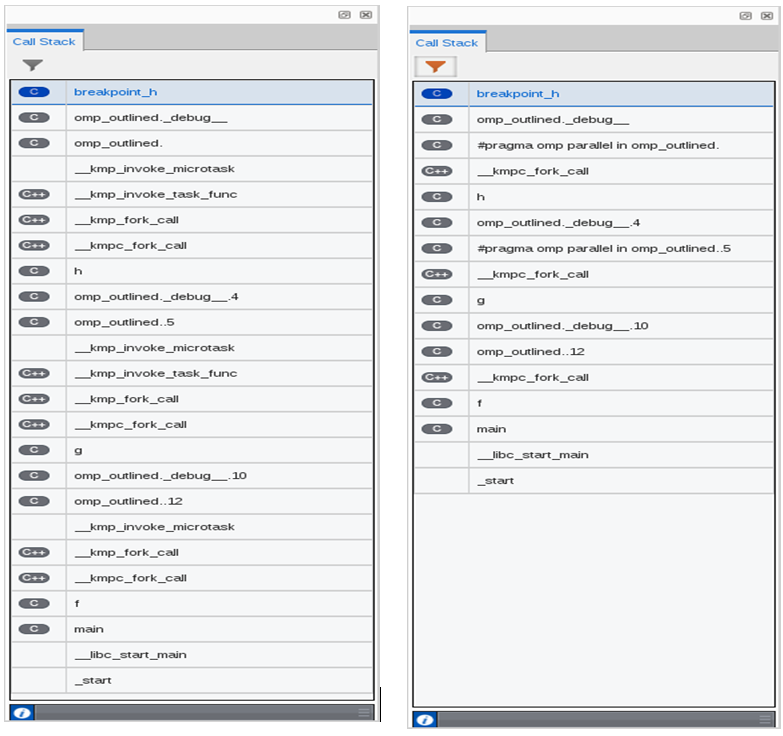
Unfiltered and Filtered OpenMP Stacks
A thread’s stack backtrace will include a mixture of frames that correspond to code the user has written and those for which the thread is running in the OpenMP runtime. The internal OpenMP runtime frames are typically noise or clutter for most users and should be filtered out.
OMPD provides an operation that identifies the location at which the stack frames for a task pass in and out of the OpenMP runtime library and user code. These are correlated with the #pragma frames shown in the callstack. Clicking on the #pragma frames will focus the source display on the locations in the source code.
Back to topFurther Information
For more details on the OMPD 5.0 support, watch this tech talking highlighting the different dynamic analysis and debugging technologies for complex hybrid applications, including how to efficiently debug your applications remotely.
Ready to try TotalView in your environment?
Back to top