Debugging Embedded Techniques in C/C++ Applications with TotalView
What is an Embedded System?
An embedded system is a computer system—a combination of a computer processor, computer memory, and input/output peripheral devices that has a dedicated function within a larger mechanical or electronic system. It is embedded as part of a complete device often including electrical or electronic hardware and mechanical parts (Embedded System - Wikipedia).
Embedded systems present their own particular set of challenges for developers who need to debug applications running on them. Often embedded systems may not have a graphical user interface, or a full set of system libraries available, instead running a lightweight or stripped-down OS, which can make debugging challenging.
Table of Contents
About TotalView
TotalView is a high performance debugging tool for Linux, UNIX, and macOS platforms. It provides debugging support for multi-threaded and multi-process applications. TotalView can be used from the user interface or from the command line interface, and supports local as well as remote debugging.
Back to topHow TotalView Helps with Embedded Application Debugging
TotalView has several features that can help when debugging C/C++ applications running on embedded systems. These include:
- Support for Remote Debugging
- Advanced Thread Control
- Mixed language debugging support
- Command Line Interface
- Scripting capabilities
- Multiple platform support
We will look at each of these features in turn and examine how they assist in debugging applications in an embedded system environment.
Back to topRemote Debugging
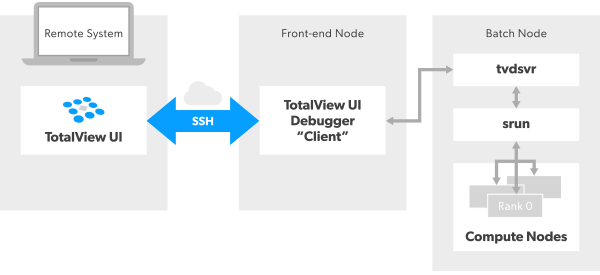
TotalView’s Remote User Interface (UI) feature allows you to run the debugger from your local system and efficiently and securely conduct your debugging on a remote system. For example, you could run the TotalView UI on your local Linux or macOS workstation or laptop and debug a remote application running on an ARM server. Currently the TotalView UI can be run natively on Linux and macOS, and a Windows version is due to be released soon.
Back to topFor more information on remote debugging see the blog post Guide To Remote Debugging and Development
Advanced Thread Control
TotalView has advanced support for debugging threads, allowing you to step individual threads or groups of threads, and to set thread-level breakpoints. You can also examine thread specific data and easily compare values across threads.
This provides extremely fine grained control over the application being debugged.
Back to topMore information about debugging multi-threaded application is available in this blog post
Mixed Language Debugging
TotalView has support for debugging mixed language C or C++ applications with Python. TotalView allows you to view the C/C++ and Python variables, examine the data exchange between the language barriers, and to debug your C/C++ code.
Currently TotalView “understands” three Python frameworks: SWIG, Ctypes, and Pybind. But, it will work just fine with other frameworks that facilitate calling from Python to C/C++ code.
Back to topFor more information on mixed language debugging see the relevant Python blog posts
How to Debug Python in Mixed-Language Applications With Ctypes and TotalView
Debugging Python in Mixed-Language Apps With Pybind and TotalView
Command Line Interface
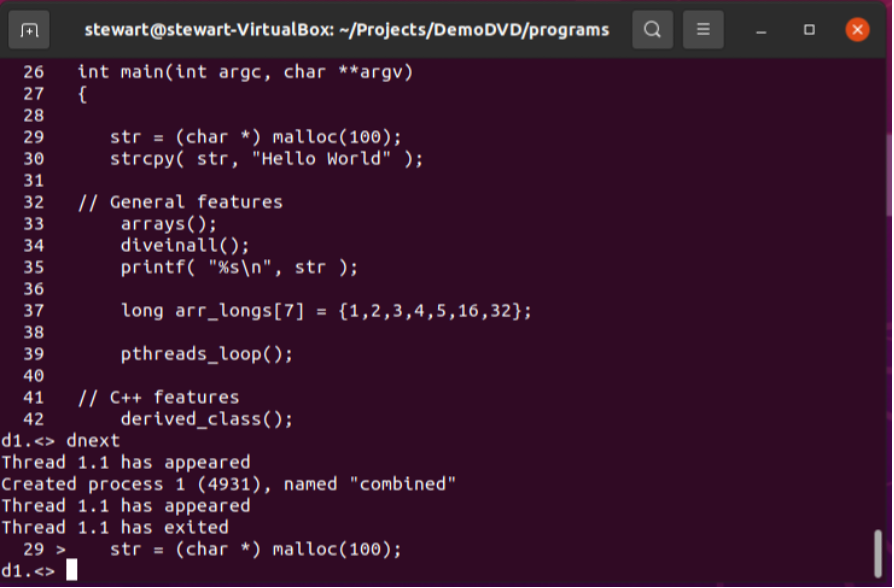
TotalView has a full featured user interface, but there are occasions when the remote system may not have the required libraries to support a graphical user interface. TotalView’s Command Line Interface (CLI) presents an alternative that can be used in these circumstances to debug an application. The CLI can be launched by using the command totalviewcli and contains a comprehensive set of debugging commands.
Back to topMore information about using the CLI is available in the Reference Guide
Scripting Capabilities
TotalView has a powerful scripting engine called tvscript which allows you to create your own scripts to run a debugging session in batch or unattended mode. This is particularly useful if you have a long running program, or want to include debugging as part of your CI/CD processes, for example as a Jenkins job. You could for instance create a tvscript that checks for memory leaks whenever code is checked in.
More information on using tvscript is available in the Reference Guide
Back to topUsing TotalView to test for memory leaks with Jenkins is described in this blog post
How to Test for Memory Leaks in Jenkins
Multiple Platform Support
As well as Linux on Intel, AMD and ARM platforms, TotalView also supports GPU debugging on both NVIDIA and AMD hardware.
The following processors are supported :
- ARM (aarch64)
- Intel/AMD (x86-64, x86)
- NVIDIA GPUs on Linux x86-64, Linux ARM64, and Linux PowerLE (Power9)
- NVIDIA Jetson AGX Xavier
- OpenPOWER (ppc64le)
- Power (ppc64, ppc32)
- SPARC
The following operating systems are supported:
- Linux including Cray Linux Environment (CLE) and PowerLE
- UNIX including AIX and Solaris
- macOS
The full platform support matrix is available here TotalView_Platforms_Guide
Back to topPutting It All Together
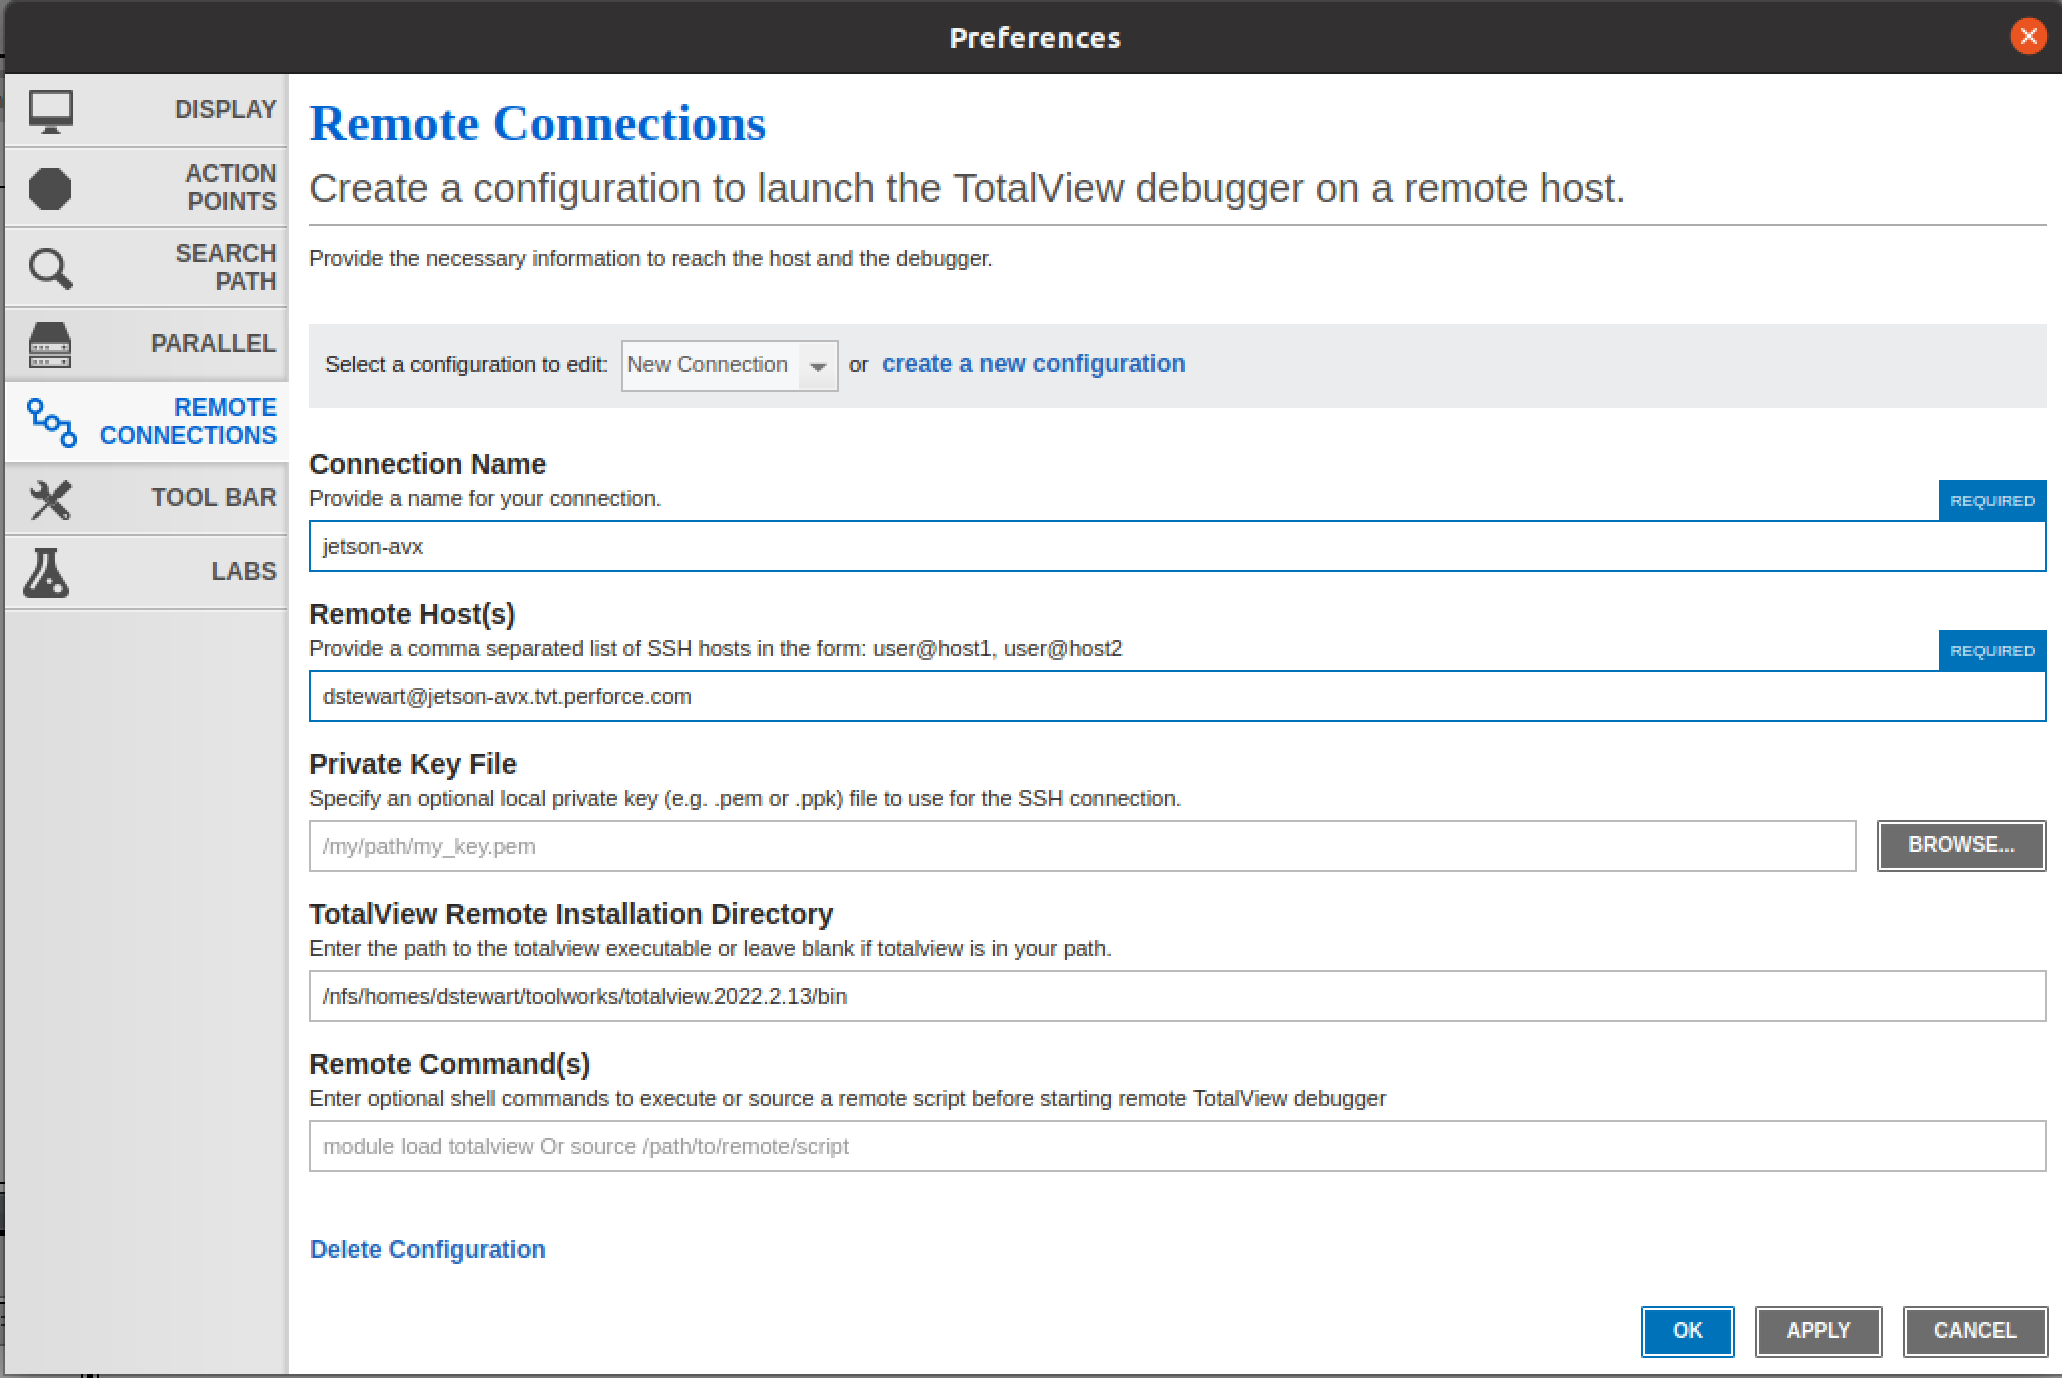
Here we look at the steps required to establish a remote connection with TotalView from a Mac or Linux machine to an NVIDIA Jetson AGX Xavier and debug a CUDA application on the Jetson machine.
Jetson AGX Xavier offers amazing compute capabilities at the fraction of the size and cost of a workstation, making it a perfect fit for a variety of autonomous machine applications.
The same version of TotalView must be installed on both the local (MacOS or Linux) machine as well as the remote (Jetson) machine in order to use remote debugging.
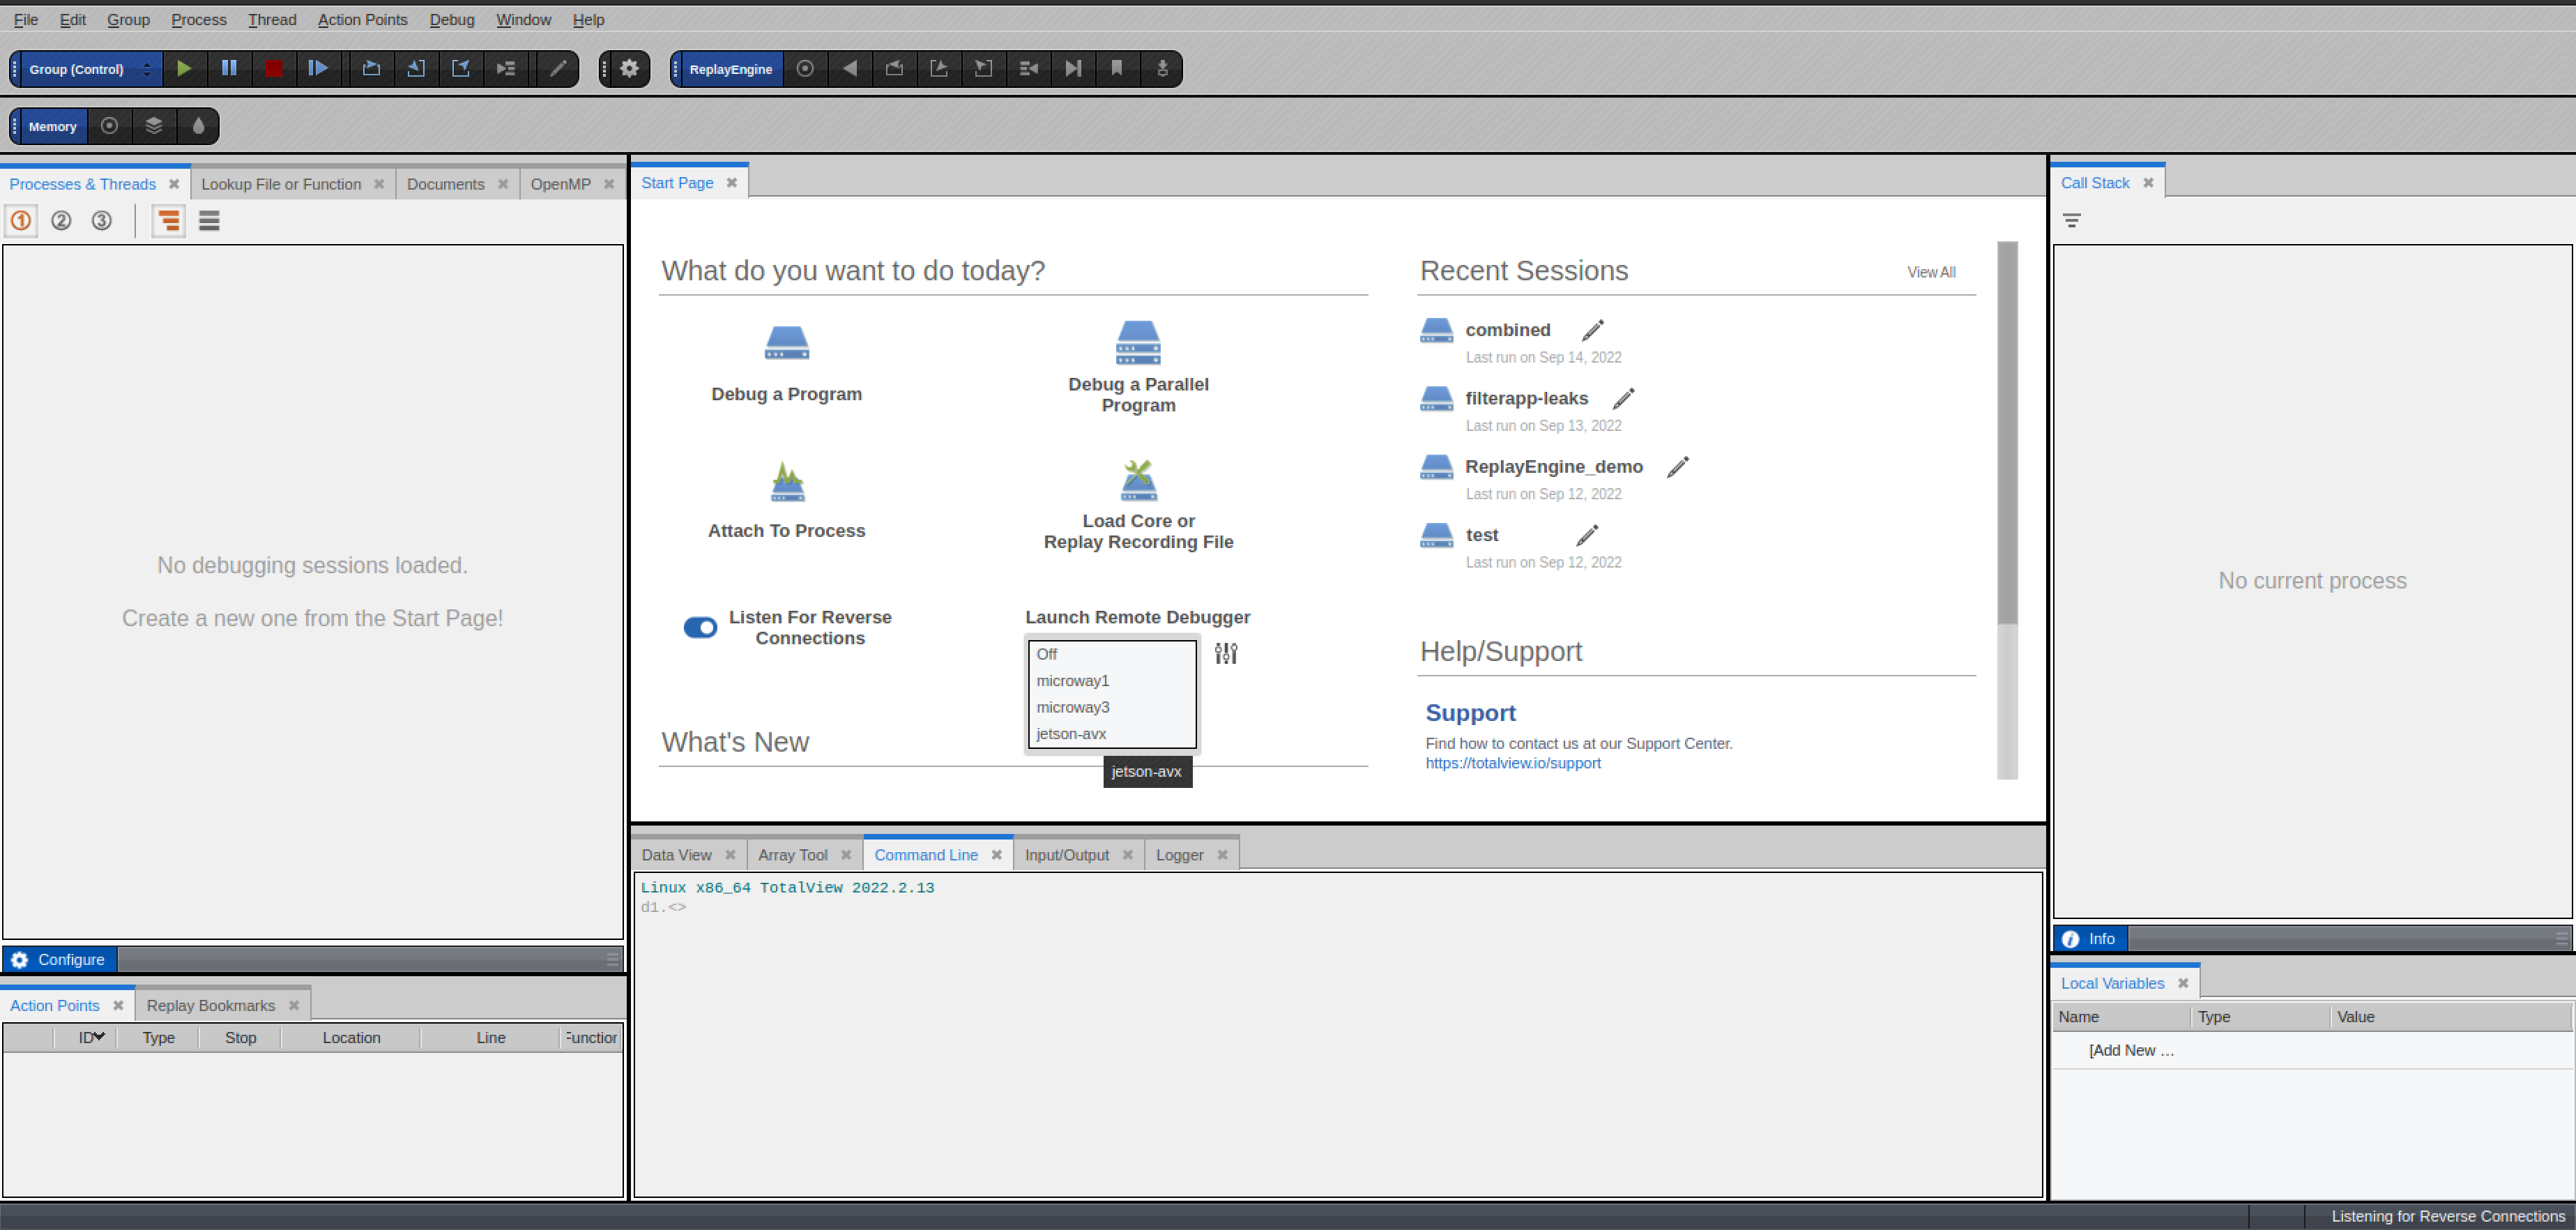
- Create a new Remote UI connection for the Jetson machine
- Select the jetson-avx connection from the Launch Remote Debugger drop down list and enter the required password at the command prompt
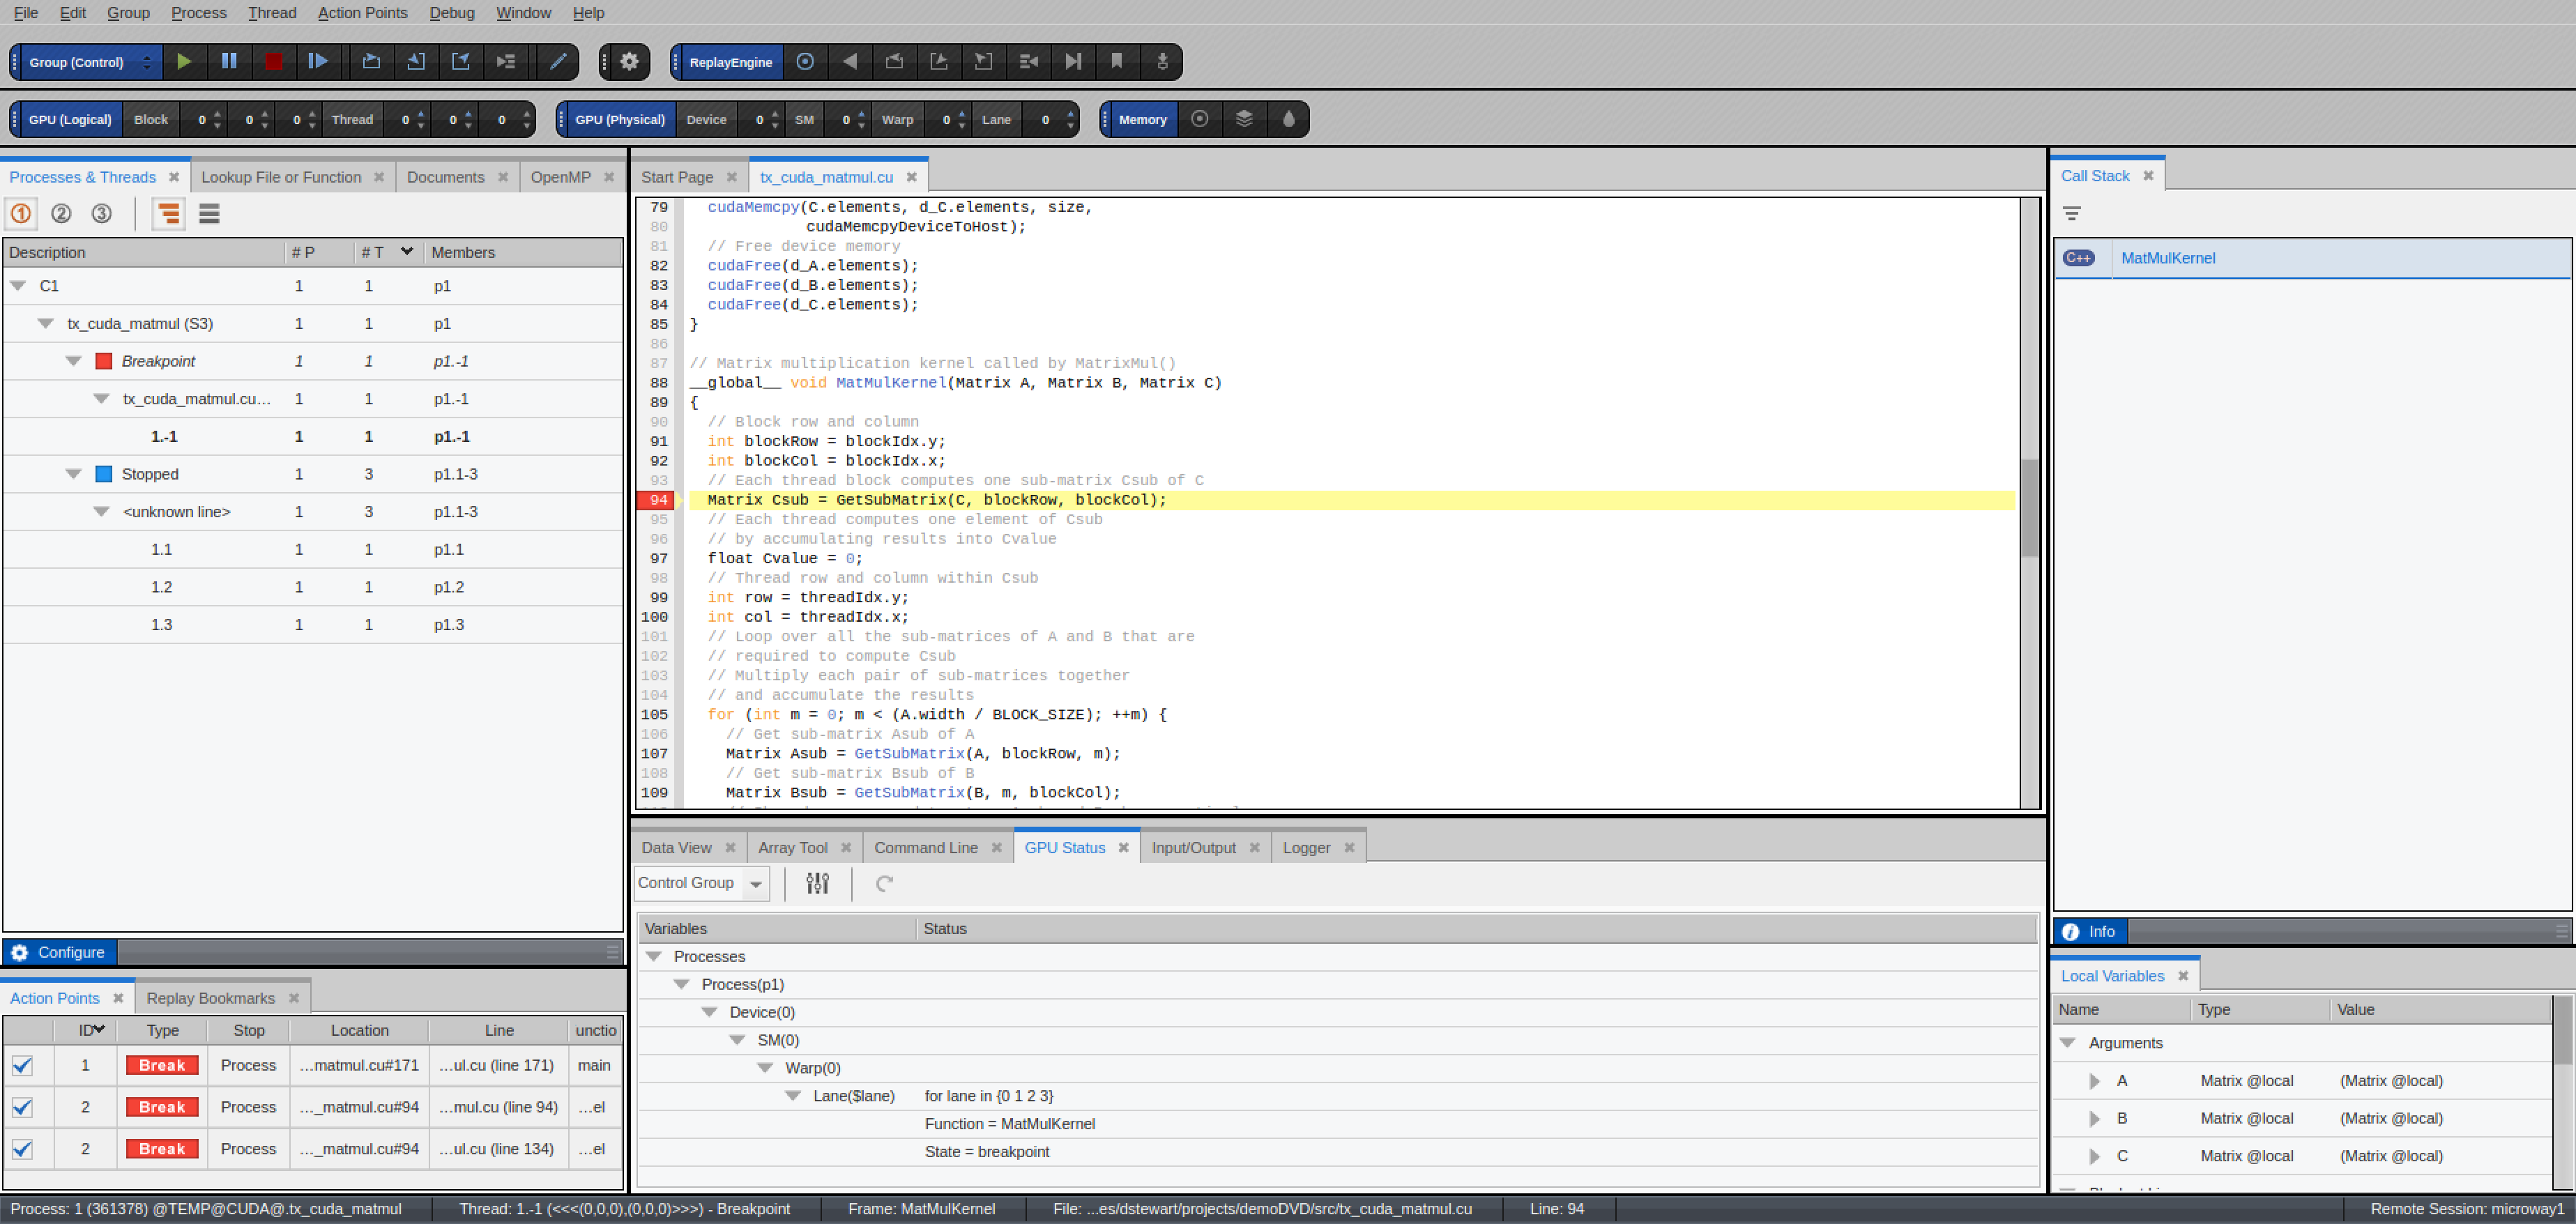
- Once a connection has been established you can now debug code running on the ARM CPU or debug CUDA code running on the NVIDIA GPU
- Start debugging a CUDA application by selecting the Debug a Program option and choosing a CUDA application. The example shown below is the CUDA matrix multiply example
- Debugging other embedded applications follows a similar workflow to that outlined above
Next Steps & Additional Resources
In this blog you learned about TotalView's debugging capabilities and steps required to debug a CUDA application. Try TotalView for free and test our debugging capabilities for yourself, today.
For additional reading, here is a blog on everything you need to know on embedded system software development.
Back to top