
How to Test for Memory Leaks in Jenkins
We have discussed in the past the nature of the memory problems which developers face, and how to test for them using both manual and automated mechanisms. In this blog we will introduce how to incorporate TotalView into your CI workflow using Jenkins.
Back to topSteps for Finding Memory Leaks in Jenkins
Now we'll walk step-by-step through how to set up TotalView to find memory leaks in a Jenkins CI system. Integration with other CI systems that understand JUnit or xUnit XML files would follow a similar approach.
Jenkins uses plugins to manage its automated testing process. The JUnit plugin provides capabilities to consume XML test reports that are generated as part of building the product. The XML reports contain information about the tests run during a Jenkins job. JUnit consumes the XML test information and provides graphical visualizations, using the JUnit graph plugin, of the historical test results. (The XML files are also compatible with the xUnit XML file format, allowing them to be easily incorporated into xUnit testing results, too.)
To incorporate the leak detection results from the TotalView HPC debugging platform into Jenkins, we’ll use JUnit to transform leak detection log information into JUnit XML consumable files. Let's start at the beginning.
1. Install the JUnit Plugin for Jenkins
Typically, the JUnit plugin is installed as part of the Jenkins installation. To double check, select Manage Jenkins from the dashboard, then select Manage Plugins. Click on the Installed tab and type “junit” in the filter box. JUnit Plugin should show up in the list. If it does not, click on the Available tab, search for “junit” again and install the plugin.
2. Create a Job to Find Leaks in Jenkins
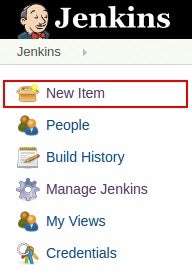
It’s time to test for memory leaks. In this example, we are assuming that a prior Jenkins job built our target application. From your Jenkins dashboard, click on New Item.
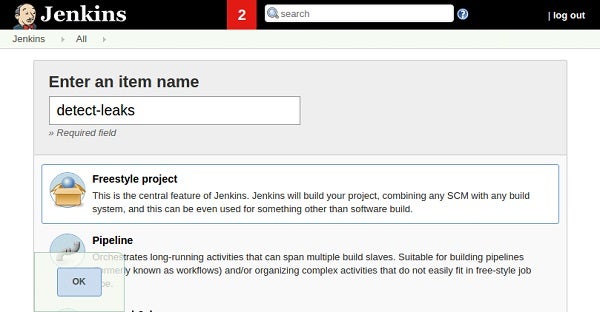
For this session, we will create a Freestyle project to check the leaks on our application. Enter an item name for the project, click on Freestyle project, and then click the OK button.
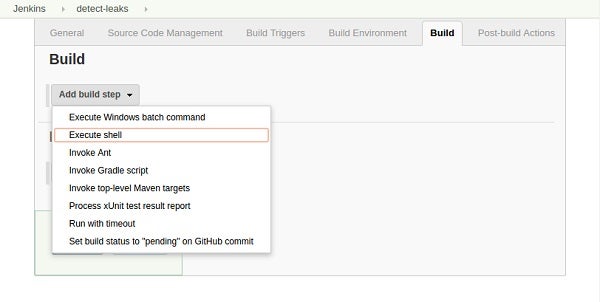
Jenkins creates our new Freestyle project and presents a page with various options. For this example. we’re only concerned with the Build section. Click on the Build tab at the top of the page and then select Execute shell from the Add build step menu.
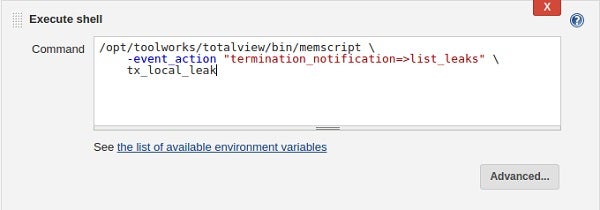
Jenkins will present the following form for providing a command to execute within a shell. It's here that we are going to leak detect our application by running it under the control of TotalView’s memory script interface, memscript. Enter the following command into the Command field for Execute shell.
/opt/toolworks/totalview/bin/memscript \
	-event_action "termination_notification=>list_leaks" \
        tx_local_leak
Note: The path to memscript may need to be adjusted depending on where TotalView was installed.
In this scenario, we are running the target application under the control of memscript directly within Jenkins. This same technique can be applied to your test harness and the test harness would be run by Jenkins.
TotalView’s memory debugging script, memscript, and the underlying memory debugging technology is bundled under the MemoryScape name. It provides many capabilities beyond leak detection, including checking for buffer overwrites, reporting double free events, accessing uninitialized memory, and other common memory problems. For any event that is surfaced, different actions can be done, such as listing the leaks found so far, listing all of the current memory allocations, saving all the memory state information into a file that can be loaded into the memory debugging UI.
Our job is now configured to run our test application under memscript and detect leaks just before it exits. When Jenkins runs our job, memscript will generate a human-readable log file with textual information about any leaks found in the target application. Next, we need to extract the leak detection information from the log file and prepare it for Jenkins through the JUnit plugin.
3. Convert memscript .log Files Into JUnit XML Files
Currently, memscript generates text log files that contains human-readable information about detected leaks, memory errors, and detailed information about all the memory issues. In order to bring this information into Jenkins, we are going to leverage JUnit’s capabilities to read test result information from XML files.
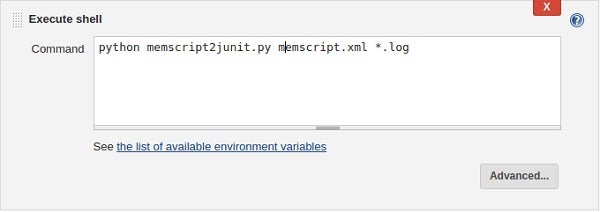
Using a handy Python script, we are going to convert memscript log file information into JUnit’s XML file format. When run, the script takes the name of the JUnit XML file to produce and one or more of the memscript generated log files to convert.
Download the Python script (remove the .txt extention)>>
python memscript2junit.py memscript.xml *.logFor a single log file, the script would produce an XML file something like the following:
<!--[CDATA[ … Details from the memscript log file … ]]-->To perform this conversion within Jenkins, simply add another Execute shell build step to the project and enter the memscript2junit.py command. I’ve placed my memscript2junit.py script in the Jenkins workspace directory so it is easy to locate. You may need to adjust paths based on where your memscript2junit.py script is located.
4. Publish Jenkins Unit Test Report With Leak Detection Results
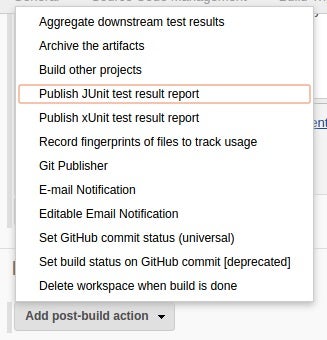
In order for JUnit to generate test reports, it needs to be told where to gather up the XML files with test result data. To do this, click on Add post-build action at the bottom of our project configuration and then select Publish JUnit test result report. As you can see, there is also an option to Publish xUnit test result report.
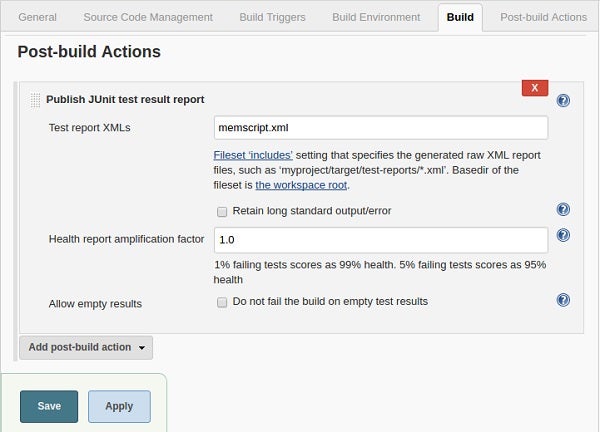
The following form allows you to specify where to pick up JUnit XML files. We can simply enter memscript.xml in the Test report XMLs field, since we are generating the memscript.xml files into the Jenkins workspace area.
Finally, click Save to save our project.
5. Generate Leak Detection Results Reports in Jenkins
With our project configured and saved, we click Build Now from the project dashboard to run it.
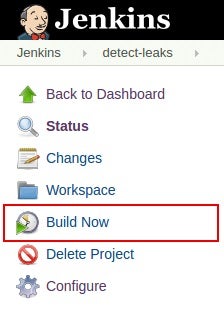
Jenkins will run our project and show the most recent build in the Build History on the dashboard.
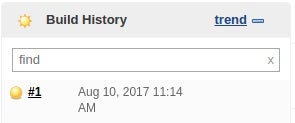
The build is marked as yellow, indicating there is a problem. Let’s explore the leak detection results.
6. Explore Leak Detection Results in Jenkins
Clicking on the build #1 link in the Build History section brings up a summary of the status.
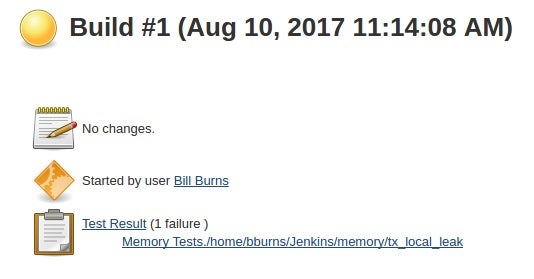
There is one test failure in our tx_local_leak test application. Clicking on the link gives us details about the failure.
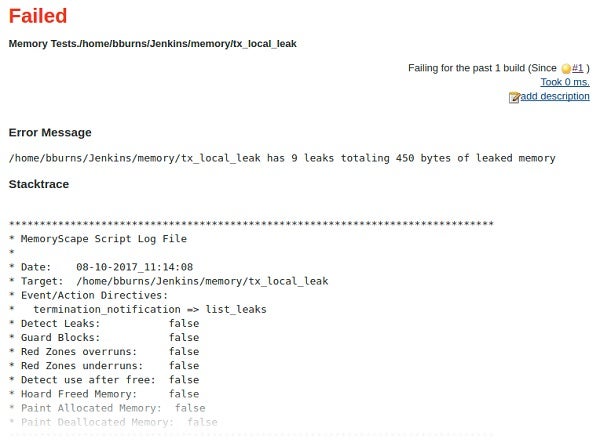
The Error Message reports that the test failed due to 9 leaks totaling 450 bytes of leaked memory. The “Stacktrace” area provides the full contents of the log file generated by memscript, including details about all the leaked memory.
The development team now has a way to automatically check their applications for memory leaks, with any failed test results automatically reported in Jenkins.
Back to topFind and Eliminate Memory Leaks
CI systems provide many benefits for simplifying the build and test process, shortening development cycles, and improving code quality. Integrating TotalView leak detection and memory usage capabilities into the CI process helps teams find and eliminate memory problems as a routine part of the CI process – and before they get noticed by your customers.
Further reading
- Memory Testing in Software Development
- Memory Leak Testing in Continuous Integration
- How Jenkins CI Parses and Displays JUnit Output
- JUnit Plugin
- xUnit Plugin
- What Is Regression Testing?