What Is Memory Optimization?
When a computer or software has a finite amount of memory, many issues can arise when that memory isn’t used efficiently. That’s why memory optimization is critical for better overall performance.
What Is Memory Optimization?
Memory optimization is a range of techniques related to improving computer memory, such as identifying memory leaks and corruption, to optimize memory usage and increase performance and application usability.
With memory optimization, memory resources are made more performant by resolving leaks and other difficult issues such as memory block overwrites and improper memory-API use.
What Is Memory Debugging?
While on the surface they may seem like synonyms, memory debugging is one of the techniques used towards the goal of memory optimization.
Memory debugging is a process of finding defects or issues in your code.
Memory debugging can help to identify why an application is crashing, or why it is producing data that is not correct. It can also be looked at as a form of dynamic analysis. It is a way of learning how an application is running so you can have a good, thorough understanding of it. You may need this information as you’re refactoring code to extend it or build in a new functionality.
Why Is Memory Optimization Important?
In a word — performance.
If you use too much memory, or build up too much memory with a program running over time, performance is going to degrade. Using too much memory without releasing it to the heap (the virtual memory available as a resource to all programs) can result in running out of memory on the machine, requiring a reboot and potentially leading to many issues.
Ideally, in a well-written program, you use memory and then return it to the heap. That way there is always something on the heap to take from. Each program is allocated a piece of the heap. If a particular program (or programs) keep sucking up a disproportionate amount of the heap, program performance suffers until an eventual crash.
A prime example of a memory leak is a software that we all have on our smartphones and personal computers — web browsers. Web browsers utilize an enormous amount of memory, which grows with every new page, tab, or window opened, causing the device to run much slower while those functions remain open.
What Causes Memory Leaks?
When an application is running, it operates with allocated memory that is consumed from the heap. After that memory is used, that variable in the program needs to be deleted or released.
If you don’t delete it, that variable is not returned to the heap and any reference to it is lost. From there, you are never able to access the memory again. This is what is referred to as a memory leak, and as these leaks pile up it is referred to as “memory bloat.”
How to Avoid Memory Leaks
One way to minimize performance issues due to memory leaks to is to prevent memory leaks from occurring in the first place. While you can never be 100% resistant to memory leaks, there are best practices that can be followed to reduce their likelihood.
In good programming practice, you allocate memory for variables and data. When you are done using that variable or data, you then deallocate it to release it. This puts the memory back on the heap so you can draw from it in another instance.
How TotalView Addresses Memory Optimization
There are a number of techniques that can be used to optimize memory usage. MemoryScape, a tool within TotalView, provides the data to improve usage and identify memory leaks in C, C++, and Fortran. With the data output from MemoryScape, you can perform process improvement to your code to reduce memory leaks and ensure that there are no memory errors.
You may not always know that you have a memory leak, but you could have a suspicion if your programs begin running sluggish. Or, there are times when there may not be any apparent performance issues at all, but smaller, less noticeable issues can build up over time and manifest into larger issues. MemoryScape detects these issues to prevent their growth into systemic problems.
Within MemoryScape, the user can customize their memory debugging options to alert the user when any of a number of memory event actions occur. With each memory event, a follow-up action can be set such as halting execution, generating a core file, or saving memory data to a file.
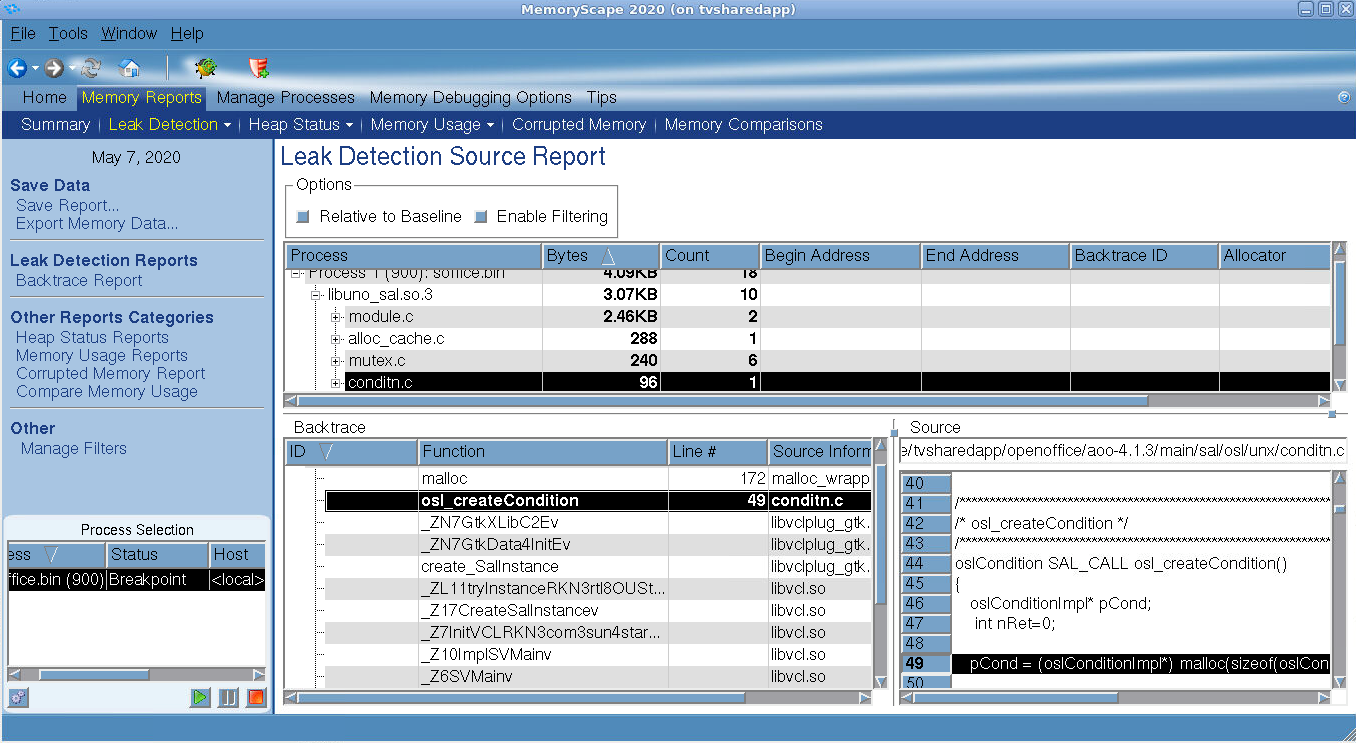
Leak detection within MemoryScape has multiple forms. The below screenshot shows a sample leak detection report:

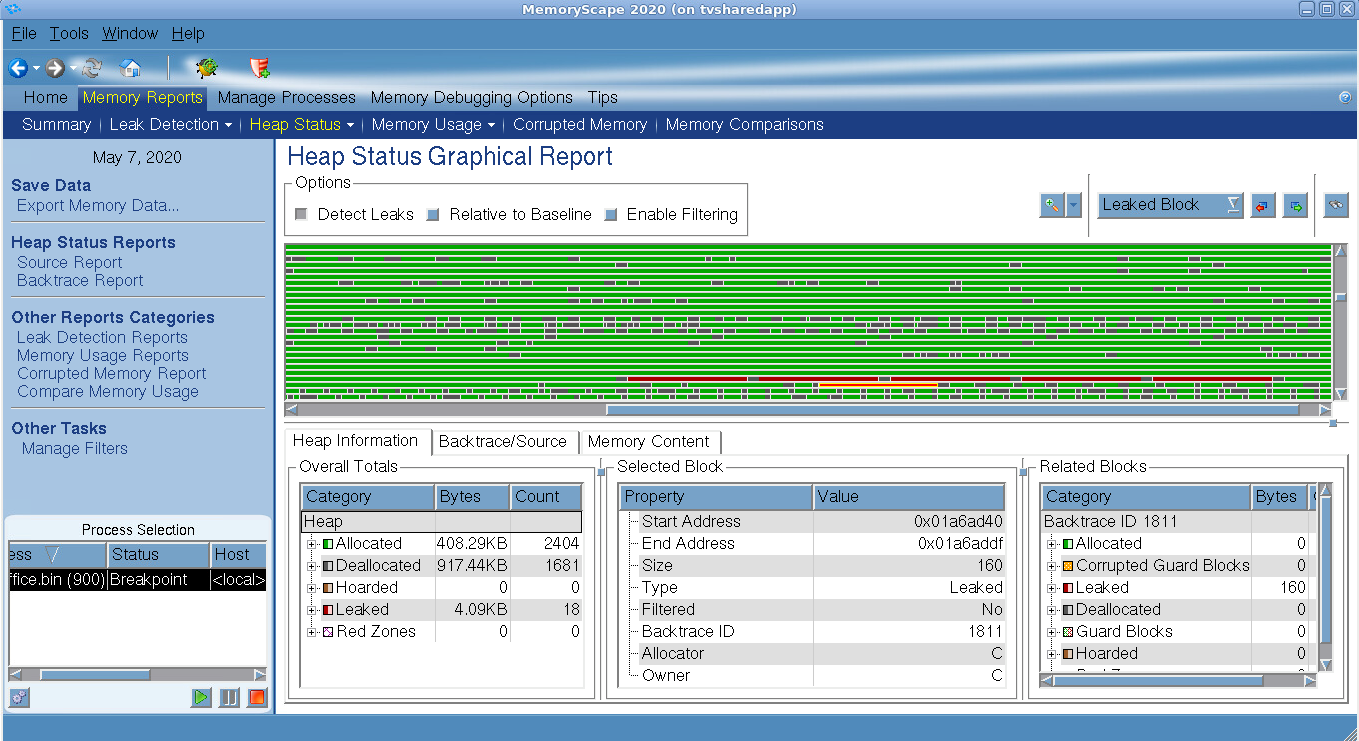
For visualization, leak detection can also be presented in a graphical report:

For a quick demo on how MemoryScape works, view this five-minute demonstration to see how it can analyze memory usage and detect memory errors.
Using TotalView for Memory Optimization
TotalView simplifies the memory optimization process, providing memory monitoring and debugging tools to efficiently manage your applications’ use of memory.
Want to try optimizing your applications with TotalView? Try free by clicking the button below.