Using Breakpoints With TotalView
This blog describes the different types of breakpoints that can be used with the TotalView debugger. In TotalView terminology, breakpoints are referred to as action points. TotalView supports four different types of action points:
What Are Breakpoints?
In software development, a breakpoint is an intentional stopping or pausing place in a program, put in place for debugging purposes. It is also sometimes simply referred to as a pause.
More generally, a breakpoint is a means of acquiring knowledge about a program during its execution. During the interruption, the programmer inspects the test environment (general purpose registers, memory, logs, files, etc.) to find out whether the program is functioning as expected. In practice, a breakpoint consists of one or more conditions that determine when a program's execution should be interrupted.
Breakpoints in TotalView
Typically, you set and clear breakpoints before you start a process. To set a source-level breakpoint, select a line number in the Source view or choose “At Location” from the Action Points menu.
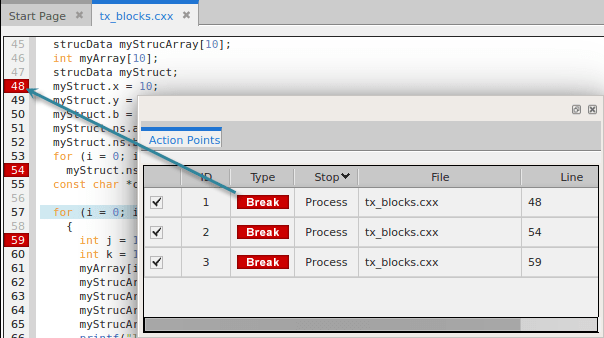
A bold line number denotes that the compiler generated one or more line number symbols for the source line. Multiple symbols might be within a single image file, for example on a "for" loop statement. Or, the line number symbols might be spread across multiple image files if the source file was compiled into the executable, shared libraries, and/or CUDA code.
No bold line number indicates that the compiler did not generate any line number symbols for the source line. However, you can still set a sliding or pending breakpoint at the line, which is useful if you know that code for that line will be dynamically loaded at runtime, for example, in a dynamically loaded shared library or a CUDA kernel launch.
What Are Evalpoints?
Evalpoints execute a code fragment when it is reached.
Evalpoints in TotalView
TotalView can execute code fragments at specified locations with a special type of action point called an evalpoint. TotalView evaluates these code fragments in the context of the target program, which means that you can refer to program variables and branch to places in your program.
You can use evalpoints to:
- Include instructions that stop a process and its relatives. If the code fragment can make a decision whether to stop execution, it is called a conditional breakpoint.
- Test potential fixes or patches for your program.
- Include a goto in C or Fortran that transfers control to a line number in your program. This lets you test program patches.
- Execute a TotalView function. These functions can stop execution and create barriers and countdown breakpoints.
- Set the values of your program’s variables.
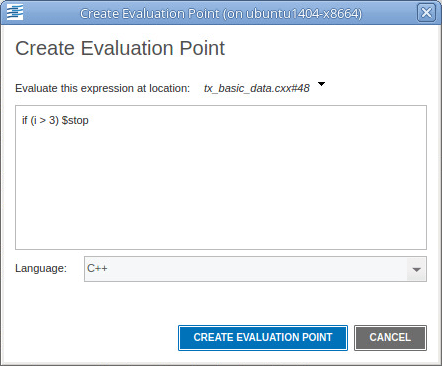
The diagram above shows the creation of an evalpoint expression that will halt a thread if the expression (i > 3) evaluates to true. You can also test out code patches in evalpoint expressions in C or Fortran without the need to recompile your code.
What Are Watchpoints?
Watchpoints are most frequently used to find a statement in your program that is writing to inappropriate places.
This can occur, for example, when processes share memory, and more than one process writes to the same location. It can also occur when your program writes off the end of an array or when your program has a dangling pointer.
Watchpoints in TotalView
Watchpoints are created as follows:
From the Local Variable view or the Data view by selecting the variable expression, right-clicking to view the context menu, and selecting Create Watchpoint.
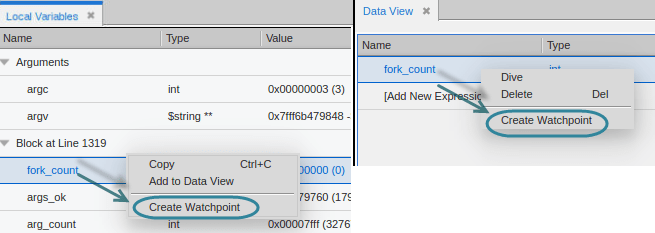
Watchpoints can also be created from the Action Points menu by selecting Create Watchpoint.
If you associate an expression with a watchpoint (by selecting the Evaluate Expression button in the Modify Watchpoint dialog box entering an expression), TotalView evaluates the expression after the watchpoint triggers. The programming statements that you can use are identical to those used when you create an eval point, except that you can’t call functions from a watchpoint expression.
What Are Barrier Points?
A barrier breakpoint is similar to a simple breakpoint, differing only in that it holds processes and threads that reach the barrier point. Other processes and threads continue to run.
TotalView holds these processes or threads until all processes or threads defined in the barrier point reach this same place. When the last one reaches a barrier point, TotalView releases all the held processes or threads, but they do not continue executing until you explicitly restart execution. In this way, barrier points let you synchronize your program’s execution.
Barrier Points in TotalView

TotalView allows you to modify the barrier points scope from the dropdown list as follows:
- Group: Stops all threads in the current thread’s control group.
- Process: Stops all threads in the current thread’s process.
- Thread: Stops only this thread.
You most often use barrier points to synchronize a set of threads. When a thread reaches a barrier, it stops, just as it does for a breakpoint. The difference is that TotalView prevents—that is, holds—each thread reaching the barrier from responding to resume commands (for example, step, next, or go) until all threads in the affected set arrive at the barrier. When all threads reach the barrier, TotalView considers the barrier to be satisfied and releases all of the threads being held there. They are just released; they do not continue. That is, they are left stopped at the barrier. If you continue the process, those threads also run.
Conclusion
In summary, TotalView supports four action points:
- A breakpoint stops execution of processes and threads that reach it. Other threads in the prvocess also stop, and you can also indicate that you want other related processes to stop. Breakpoints are the simplest kind of action point.
- An evalpoint executes a code fragment when it is reached.
- A watchpoint monitors a location in memory and stops execution when it changes. A watchpoint can stop all the threads in a group or a process, or can include an expression to evaluate.
- A barrier point synchronizes a set of threads or processes at a location.
In this blog, we've used CentOS 7.3 and TotalaView 2021.2. You can view all supported TotalView platforms here and then start a free trial to test out these action points for yourself.
