MPMD Debugging with TotalView
In this blog post we will look at how to debug a simple MPMD application with TotalView. The program is an MPI application with 2 executables exec1 and exec2. The exec1 program sends a message to exec2 which outputs the message. Both programs are run using MPI and 2 processes each.
Back to top
What is MPMD ?
MPMD (Multiple Program Multiple Data) is a high level programming model where tasks execute different programs simultaneously, and all tasks may use different data. MPMD programs are not as common as SPMD (Single Program Multiple Data) applications but may be better suited for certain types of problems.
Back to topAbout TotalView
TotalView is a high performance debugging tool with support for multi-threaded and multi-process applications. TotalView can be used from the user interface or from the command line interface, and supports local as well as remote debugging.
Back to topRequirements
This blog post uses TotalView 2023.2, Ubuntu Linux 20.02 and OpenMPI.
Steps
- Start with two example MPI applications exec1.cpp and exec2.cpp:
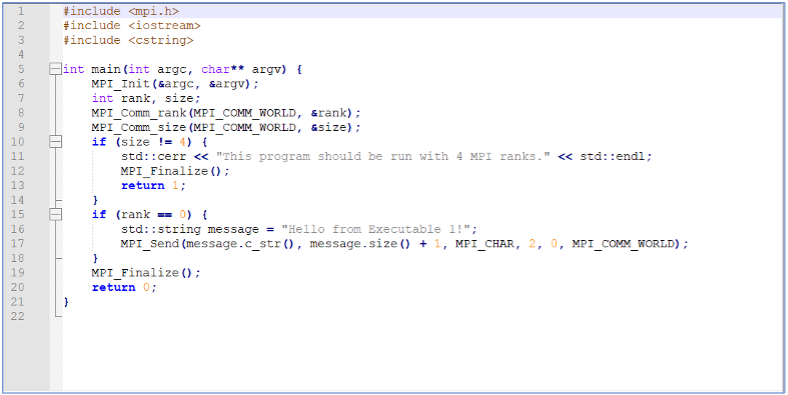
exec1.cpp
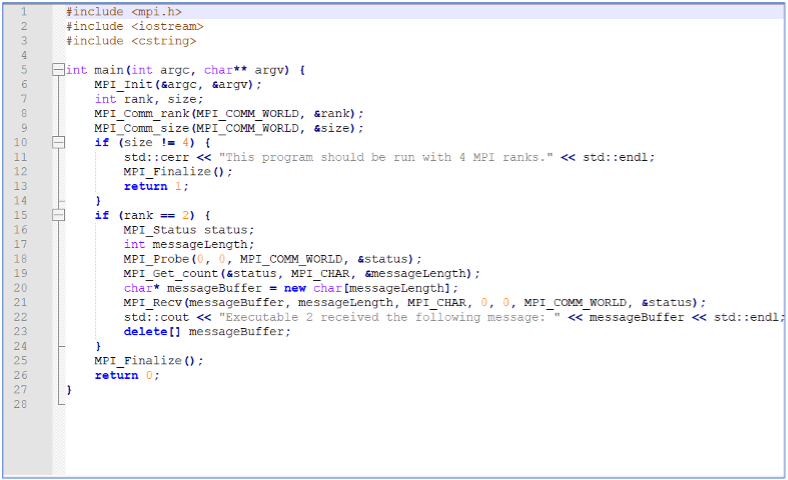
exec2.cpp
- Compile the exec1.cpp and exec2.cpp programs using the mpiCC compiler with debugging enabled:
$mpiCC -g exec1.cpp -o exec1
$mpiCC -g exec2.cpp -o exec2
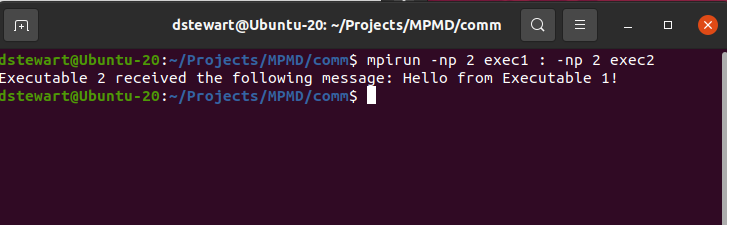
- Start the examples with mpirun to check they are working correctly. In this example we use 4 MPI ranks in total, 2 MPI ranks for exec1 and 2 MPI ranks for exec2:
$ mpirun -np 2 exec1 : -np 2 exec2
- Start the MPMD program under TotalView’s control:
$totalview -args mpirun -np 2 exec1 : -np 2 exec2
- Press GO to start debugging.
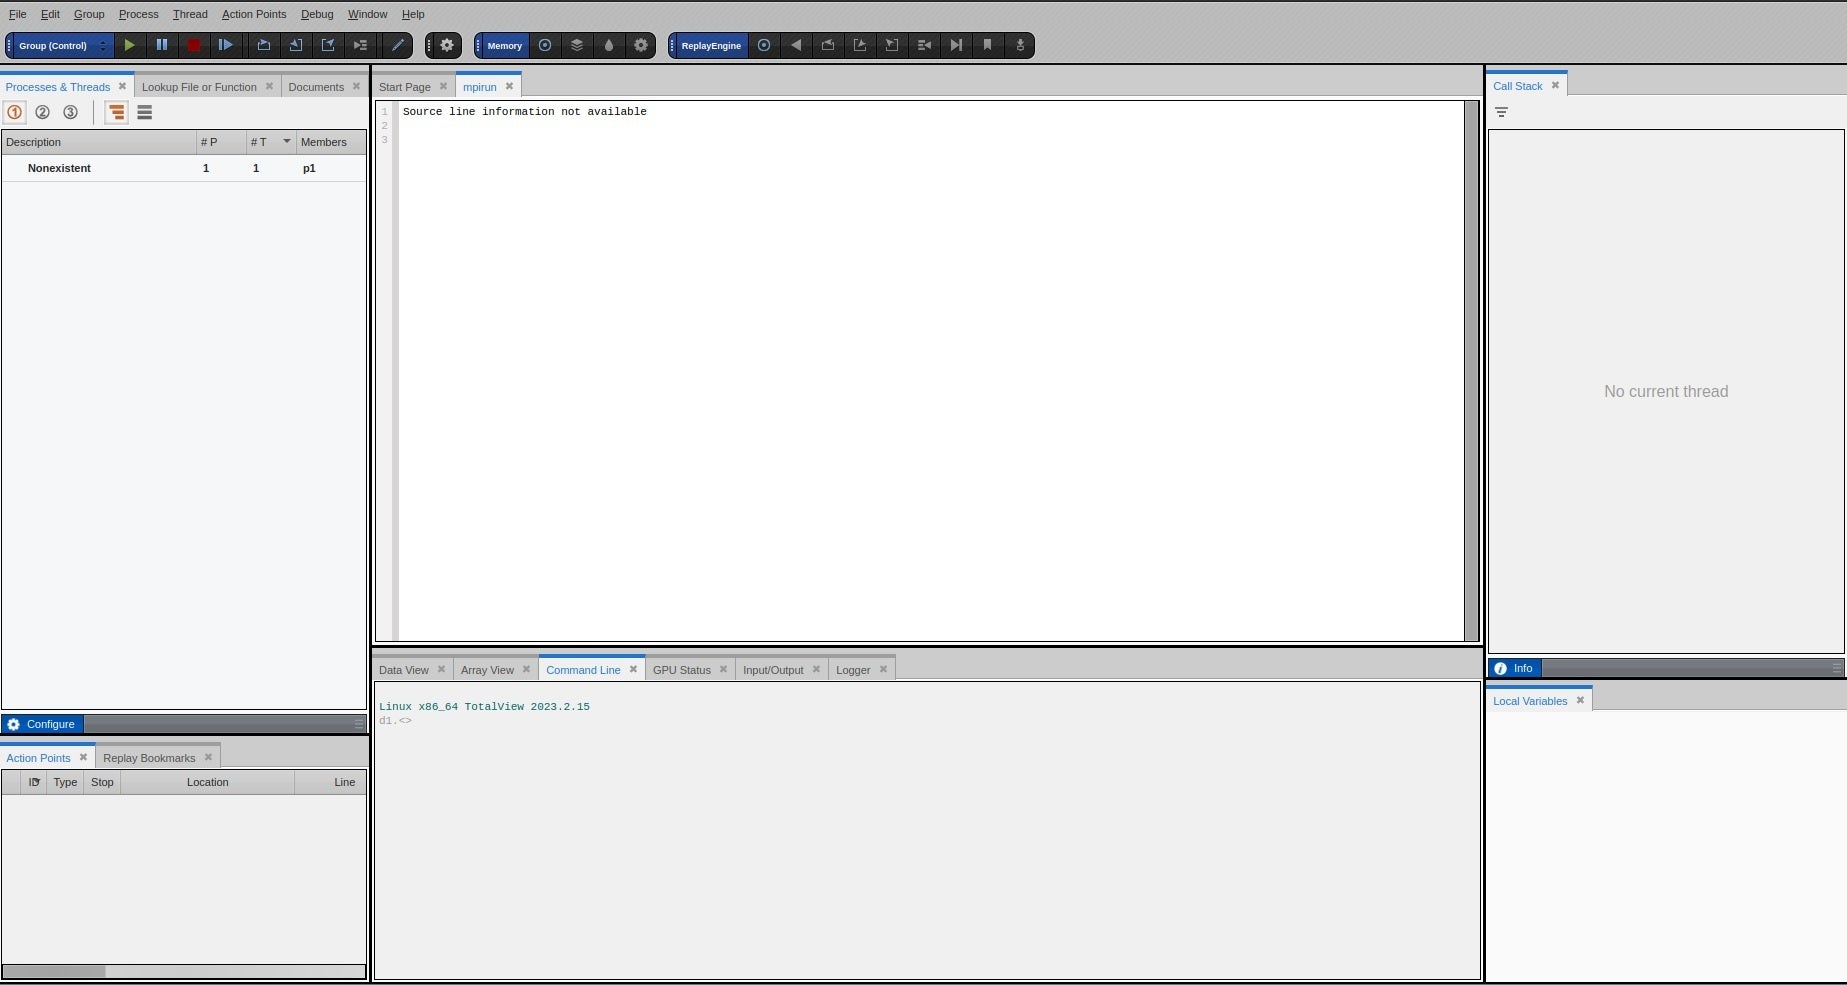
- TotalView asks if you want stop the job now. Select yes.
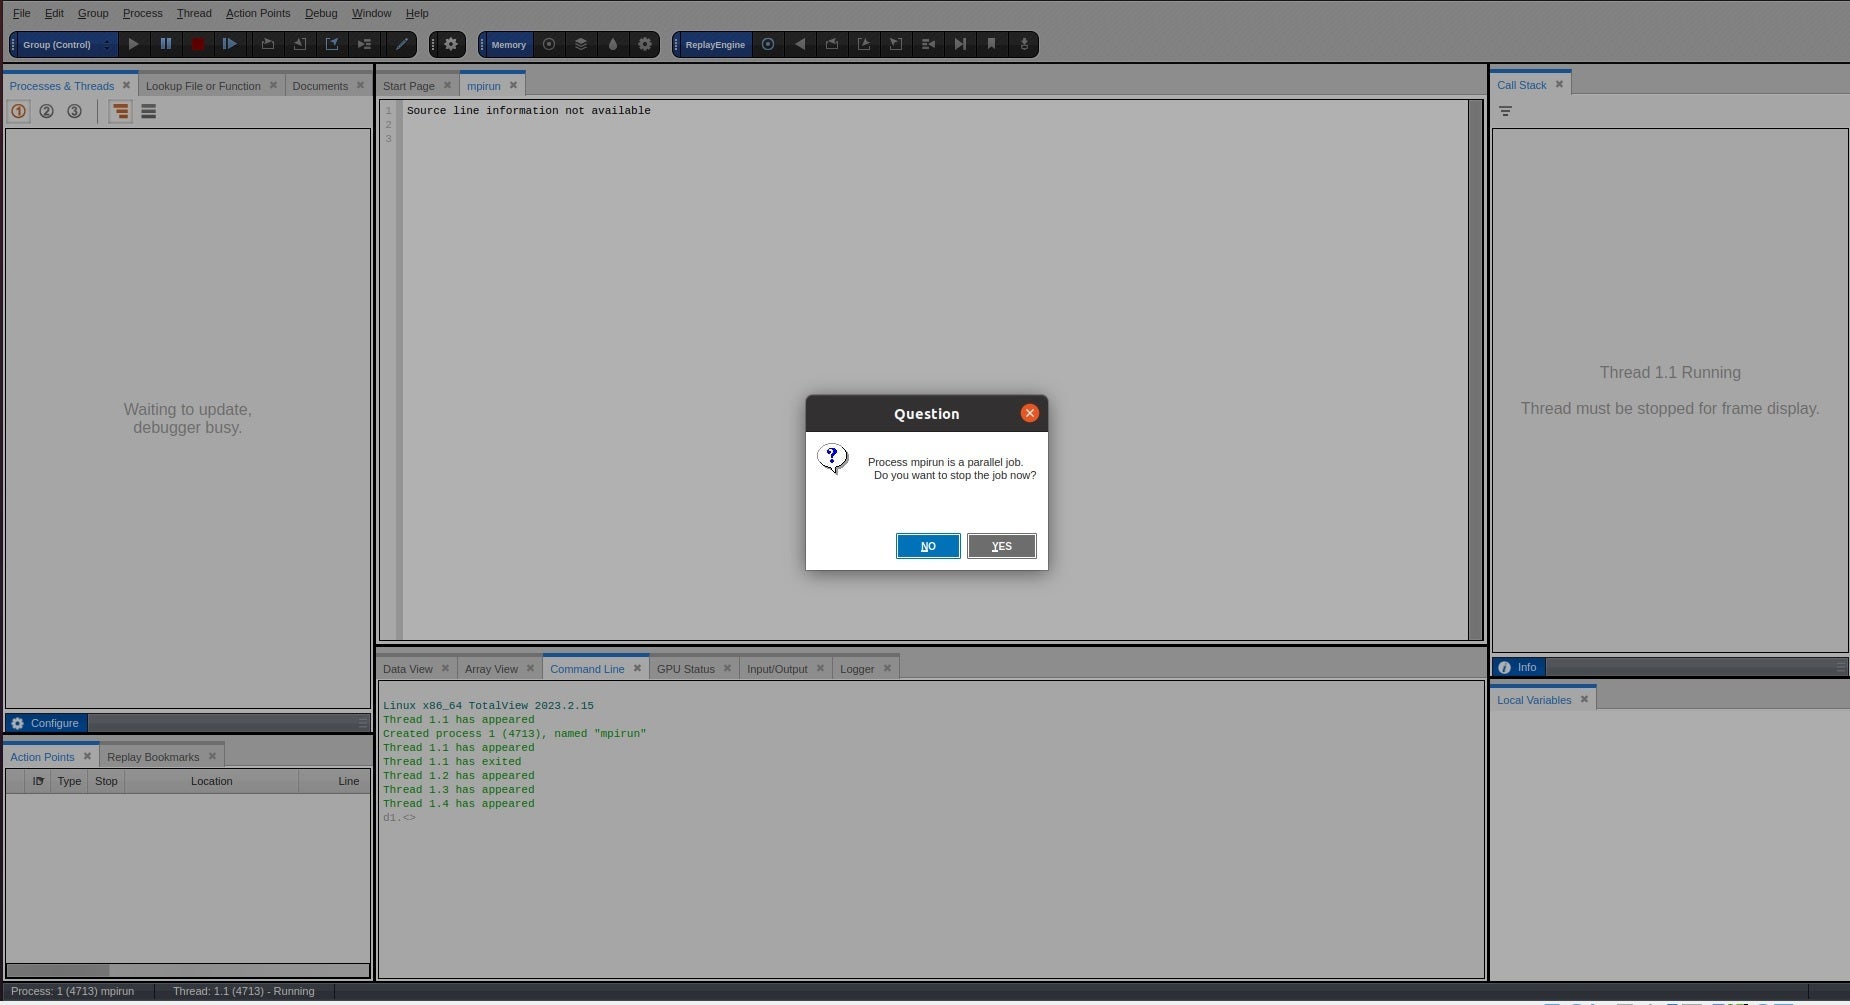
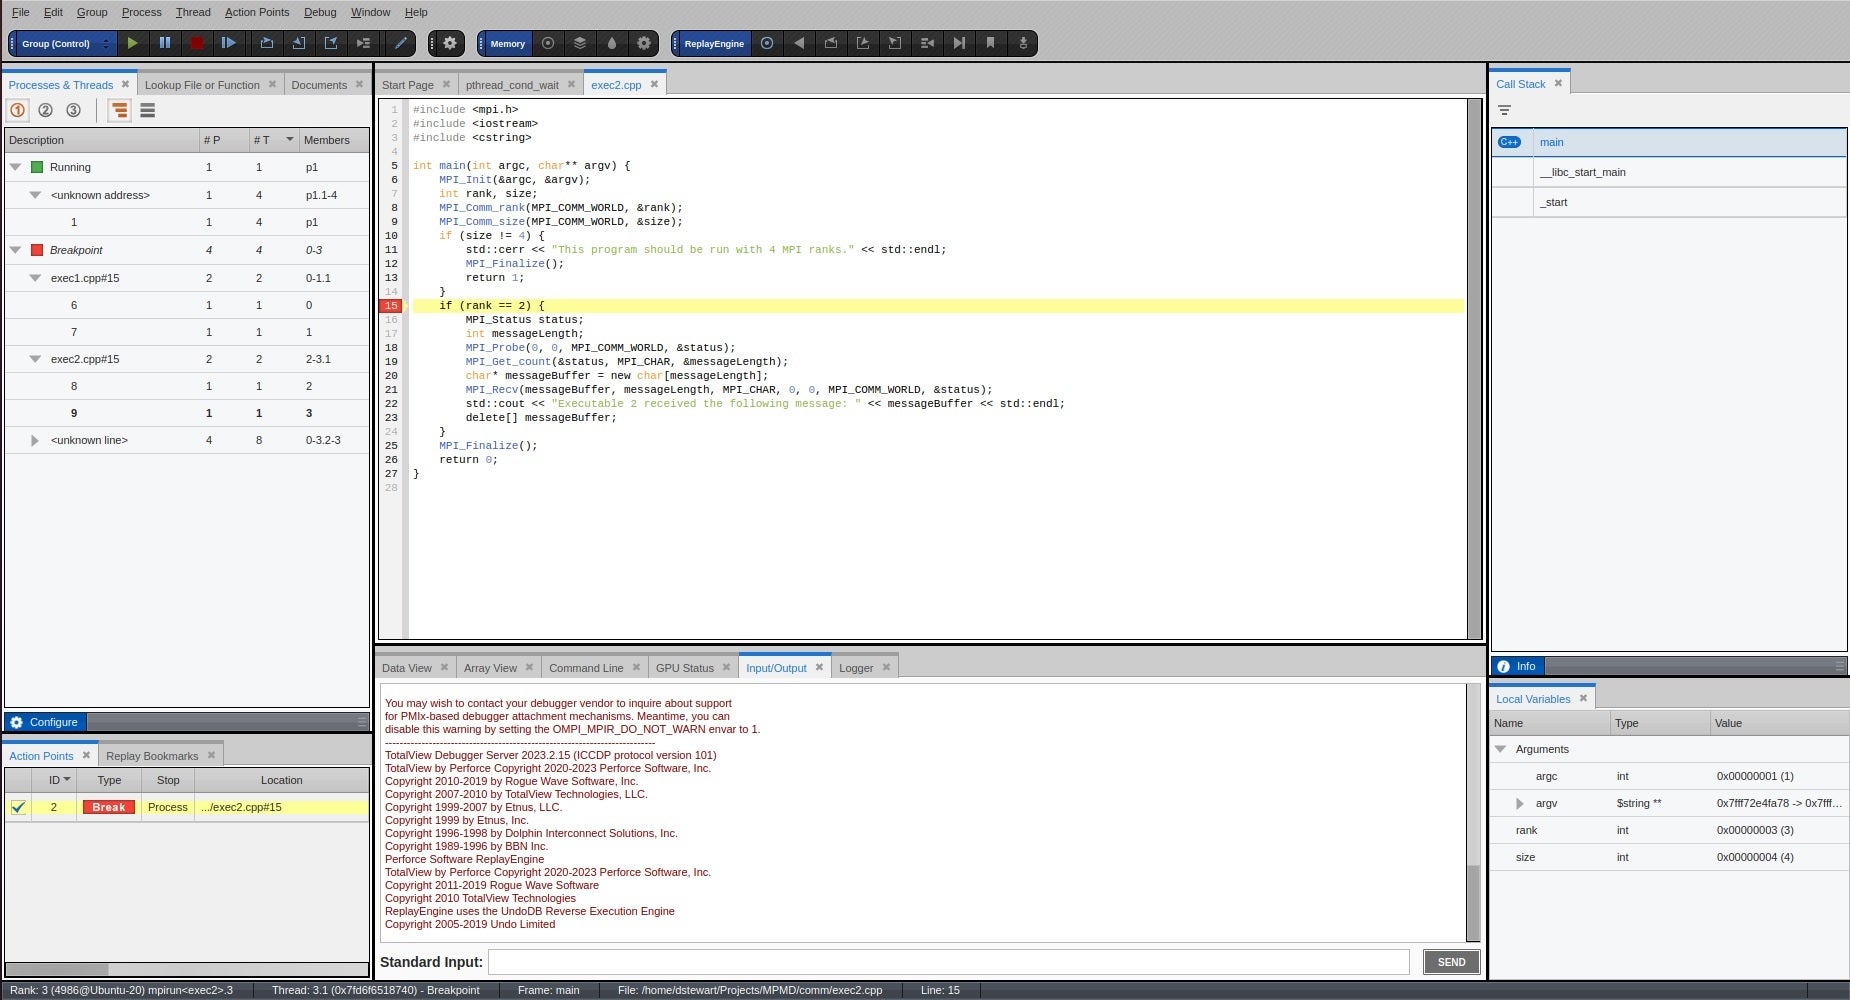
- Add a breakpoint at line 15 in the exec1.cpp file.
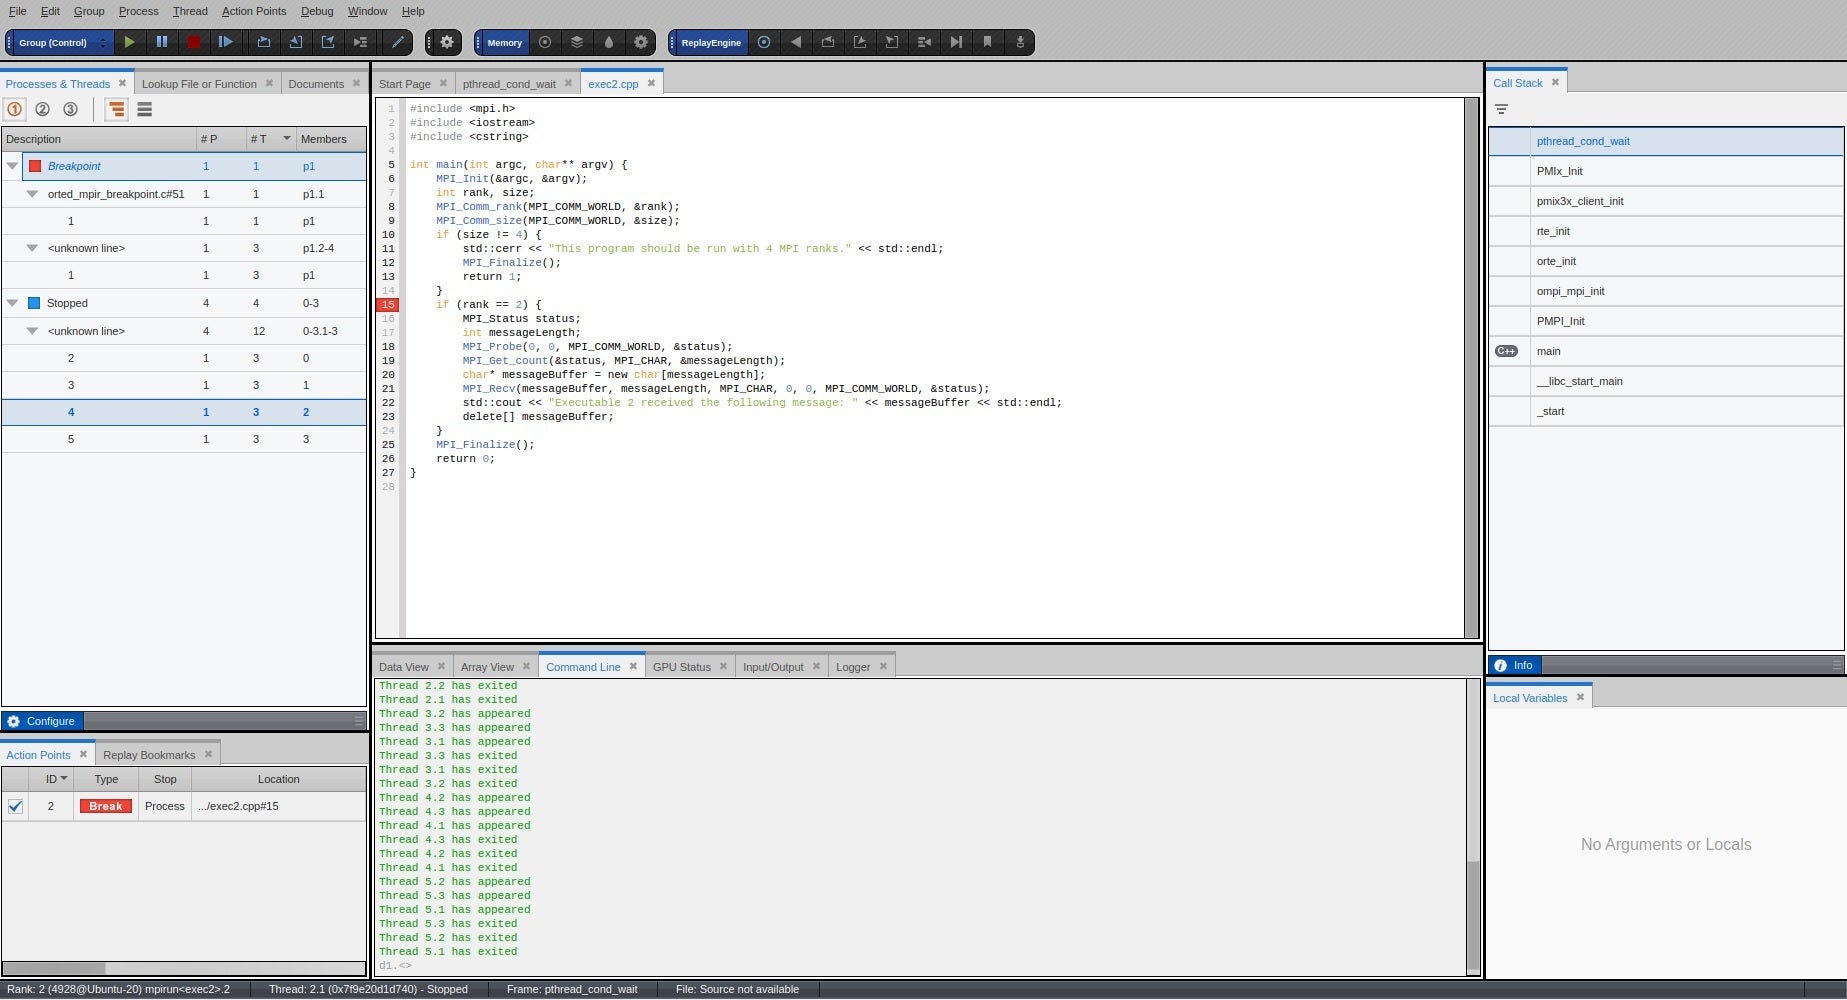
- Select process rank 2 or rank 3 in the Processes and Threads window. TotalView displays the exec2.cpp file. Add a breakpoint at line 15 in the exec2.cpp file.
- Press GO to run all 4 processes. The Processes and Threads window shows that MPI ranks 0 and 1 have stopped at line 15 in exec1.cpp and MPI ranks 2 and 3 have stopped at line 15 in exec2.cpp.
- Change the focus to exec1.cpp by double clicking on process rank 0 or 1 in the Processes and Threads window. From the drop down list select Group (Share). This allows TotalView to control only the MPI ranks associated with the current share group (exec1).
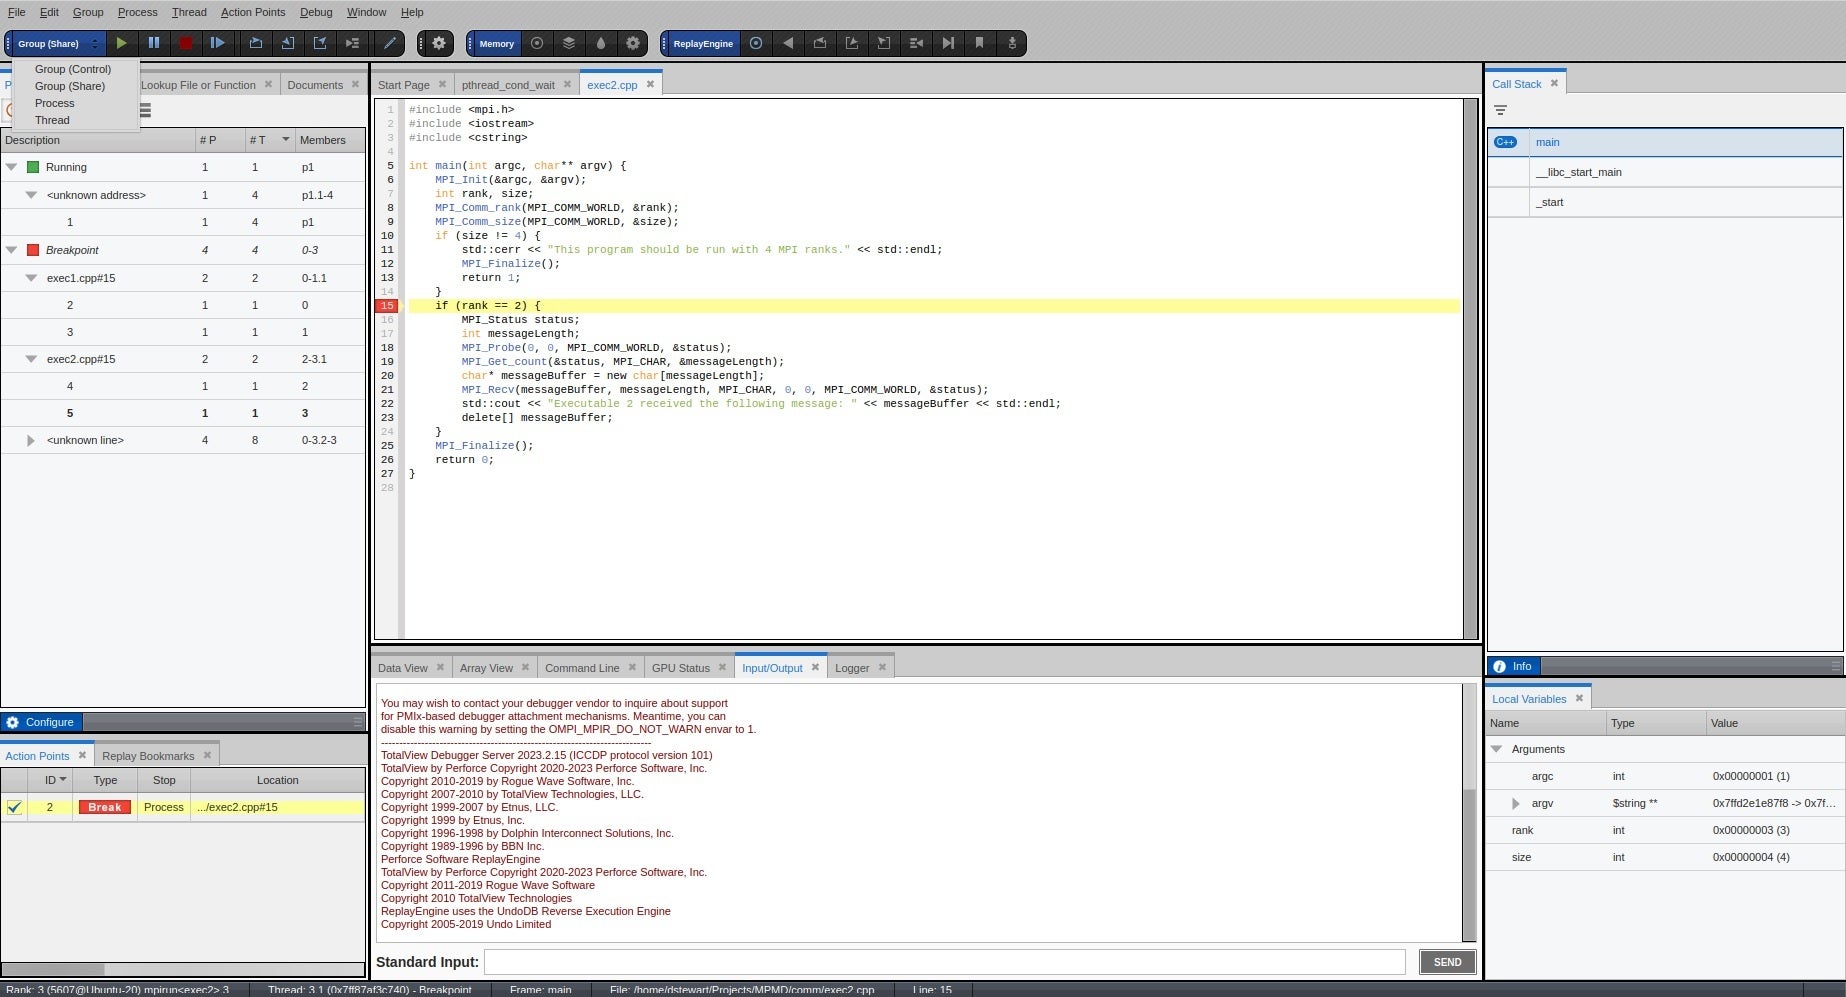
- Press GO to run MPI ranks 0 and 1. The Processes and Threads window updates to show that MPI ranks 0 and 1 are running, and MPI ranks 2 and 3 are at a breakpoint.
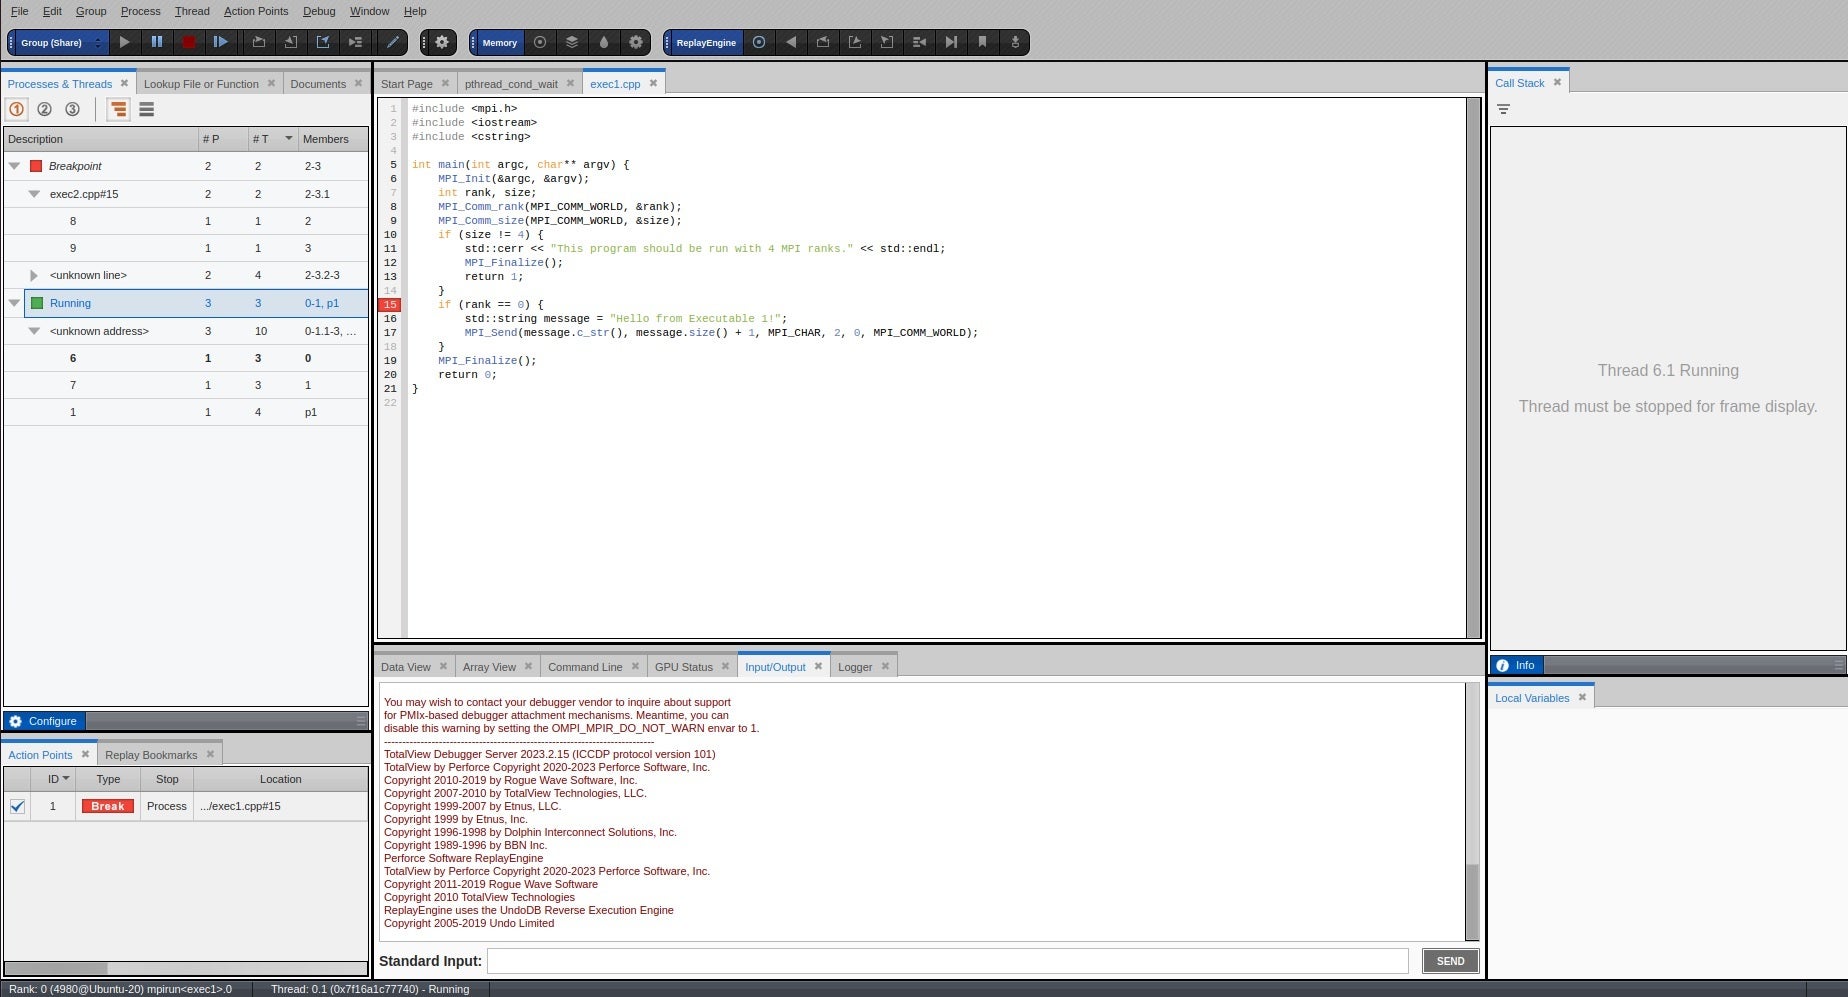
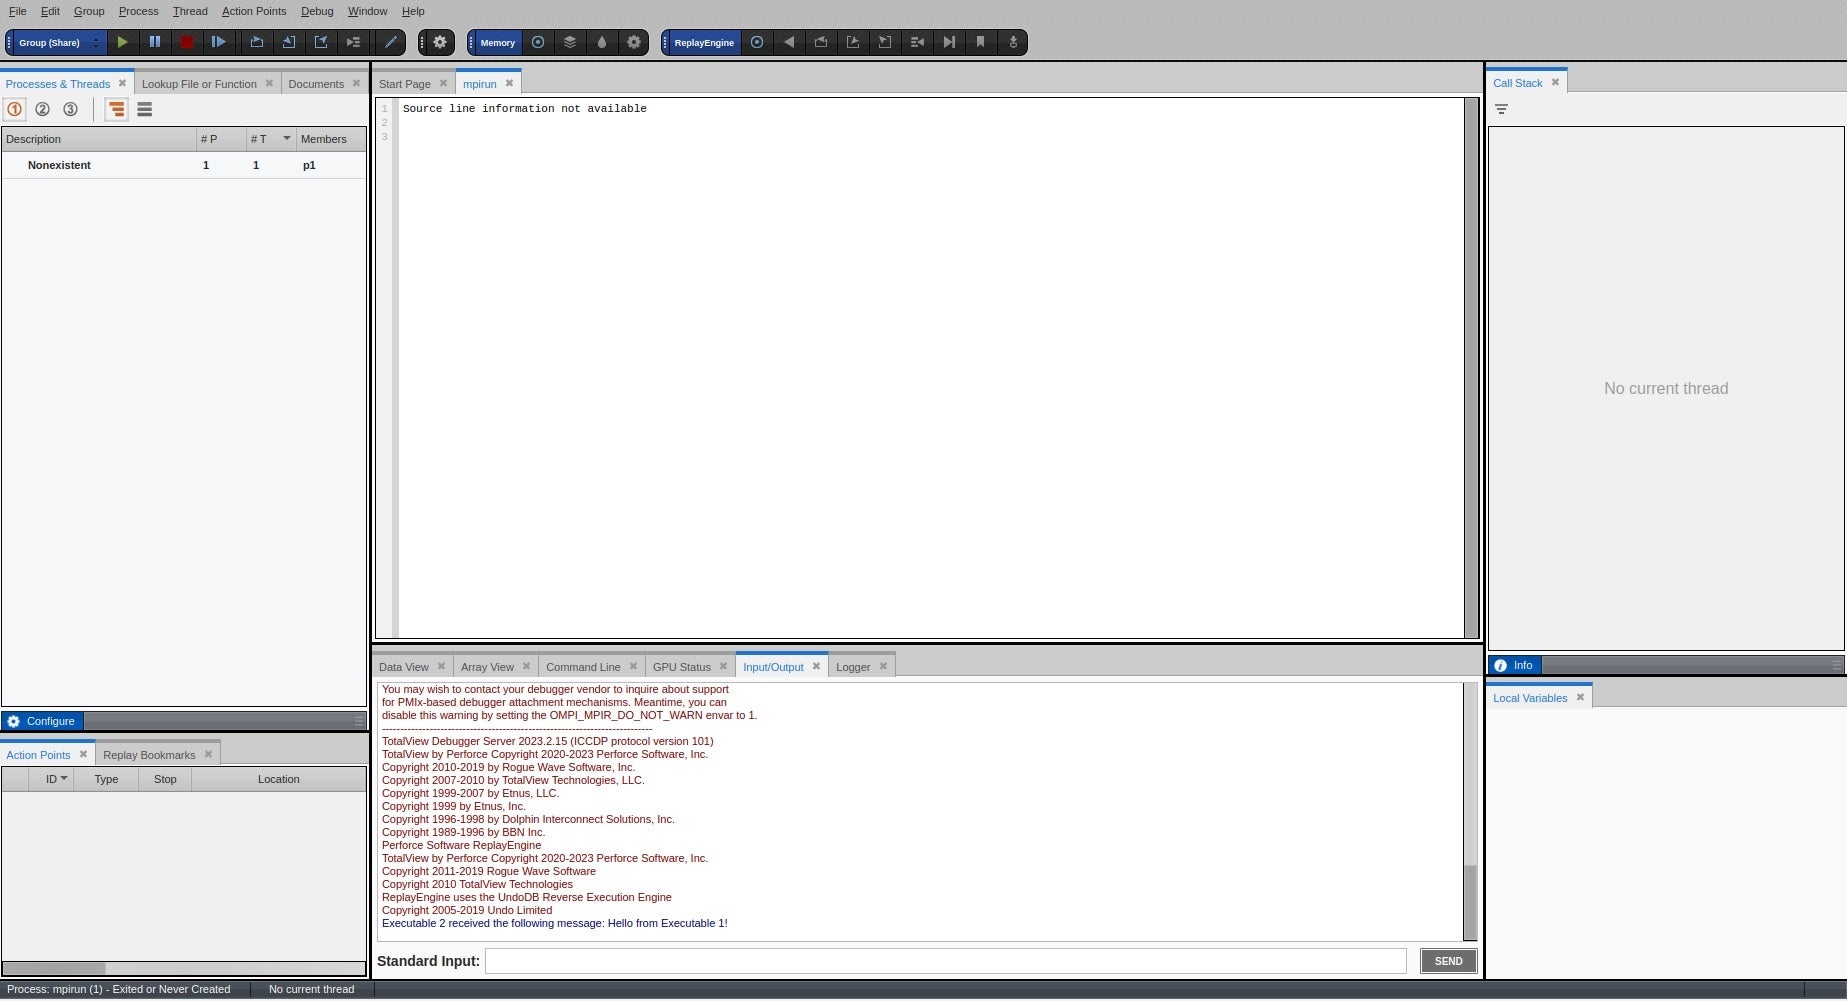
- Change the focus to MPI rank 2 or 3 by double clicking the process in the Processes and Threads window. Press GO to run MPI ranks 2 and 3. The program runs and the TotalView Input/Output window displays: “Executable 2 received the following message: Hello from Executable 1 !”
There is more information about how TotalView uses share groups and what happens to other share groups when you step a specific share group in the TotalView User Guide.
Back to topNext Steps & Additional Resources
In this blog post we have seen how we can run MPMD programs under TotalView’s control. You can try TotalView for free and test our debugging capabilities for yourself, today.
For additional reading and resources check out our resources page.
Back to top