Debugging Python and C/C++ Mixed-Language Applications
Python’s popularity has grown so much and so fast, that most reports now list it as one of the top five most popular programming languages, along with C and C++. In high-performance computing environments, Python and C / C++ are often used together, resulting in complex, mixed-language applications. This article will explore the challenge of debugging Python in multi-language applications (specifically debugging C / C++ and Python applications) and suggest tools to streamline the process.
Debugging Python vs. Mixed-Language
Python programmers have many choices to diagnose bugs in their Python code.
Python is shipped with pdb and provides an interactive source code debugging. PyDev IDE for Eclipse and Spyder provide strong environments for debugging Python. However, few debuggers provide a seamless solution for mixed-language debugging.
Back to topWorking With Python and C Code
Large institutions and companies across industries from science to finance have incorporated Python into their development cycles. Scientists, data analysts, and developers use Python to create front-end algorithms and logic, while using C / C++ on the back end to maintain the underlying speed of their existing knowledge base. In complex HPC environments, these mixed-language applications are often running thousands of parallel processes and threads across multi-core nodes.
During the development process, developers rely on debuggers and dynamic analysis tools to understand how their program runs and avoid failures. In multi-language applications, they’re not only debugging Python script and C code, they also need to be able to analyze the calls across language barriers and the flow of data between them.
Back to topPython Debugging in Mixed-Language Applications
Debugging in one language is hard enough, especially when you have many threads. When debugging multi-language applications, it’s easy to get lost in the glue code. Data types don’t always match, so transitions are tough. Untangling the confusing maze of library calls, data translations, and linked-in CUDA code can be convoluted and time-consuming. To make matters more difficult, neither Python debuggers nor C++ / C debuggers provide a comprehensive view across multiple languages.
A Python process may crash, hang, or simply produce incorrect results after calling native libraries or vice versa. These types of bugs are difficult to debug within Python itself. As a result, a developer may decide to use a C++ / C debugger. Since Python is an interpreted language, a typical debugger can only debug the interpreter instance and examine the process at the interpreter level. The result is a complicated stack trace that includes low-level details of functions and variables of Python interpreter. Here is a sample of the stack trace:

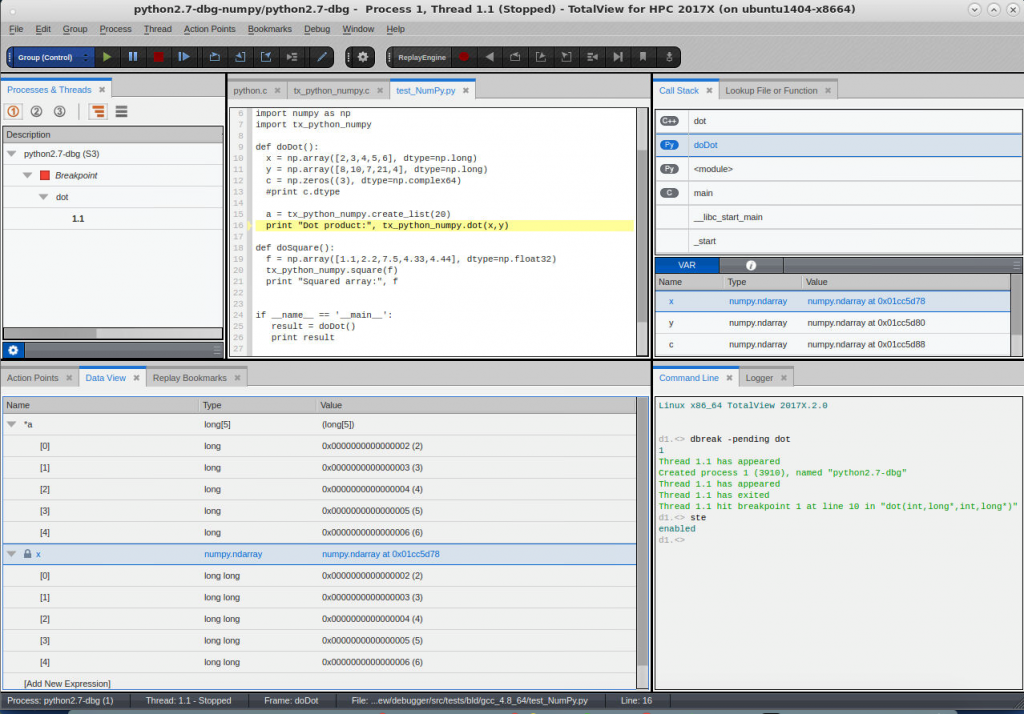
To properly diagnose a problem in the Python code, developers need to see details at an application level where their Python function names and variables are available in the call stack. They need to see both languages in the same debugger, with a shared stack frame.
Back to topDebugging Machine Learning Call Stacks
Mixing Python and C / C++ languages is also quite common in machine learning or deep learning technologies. In this video, we look at how Python-C / C++ transformations combined with a multithreaded, multiprocess debugger like TotalView helps you understand what's going on within your deep learning code.
Debugging C / C++ and Python With TotalView
Developers require tools that allow them to view unified call stacks for Python and C++, set breakpoints, step between Python and C / C++ code, and simultaneously inspect data in Python and C / C++. TotalView is an industry-leading debugger and dynamic analysis tool for HPC environments running multithreaded and multiprocess applications. It provides a seamless solution that supports a mixed-language debugging methodology.
- Support for hiding glue code stack frames.
- Mixed data view with both languages present.
- Ease of Python with the speed of existing algorithms in C++.
TotalView provides a very easy workflow for establishing your Python and C++ / C debugging sessions. Setting a breakpoint in your C / C++ code is straightforward. When hit, it presents an integrated Python and C / C++ stack trace. The “glue” code and Python interpreter level frames are stripped away, leaving the call flow the developer needs to see.

Developers can simply drag Python and C++ / C variables into the Data View and examine their values, making sure that the data has crossed the language barriers correctly. This, coupled with its advanced C++ / C debugging capabilities such as reverse debugging, make TotalView a solid solution for debugging the execution paths and data exchanges between Python and C / C++.
Python Support For Data Analytics
In scientific, technical or business environments, scientists and data analysts often use Python in combination with C / C++ to create complex algorithms. These data-intensive processes and applications rely on Perforce’s IMSL numeric libraries, a collection of commercially available algorithms, to save development time. Using our published wrappers, Python applications can easily call the IMSL C library directly.
Back to top