Debugging in C
Application development in C remains strong despite the advent of other languages such as Java and Python, predominantly due to its performance, flexibility, and its use for memory management.
This short blog will show how to compile a simple C application for debugging and to debug that application with the TotalView graphical debugger. The example calculates the Fibonacci series up to a set of terms (10) defined by the program.
Requirements for this Example
This example uses CentOS 7, gcc 4.8, and TotalView 2020.2 You can use any supported Linux version and compiler.
Don't have TotalView? Request an evaluation to try this for yourself.
Table of Contents
8 Steps for Debugging in C
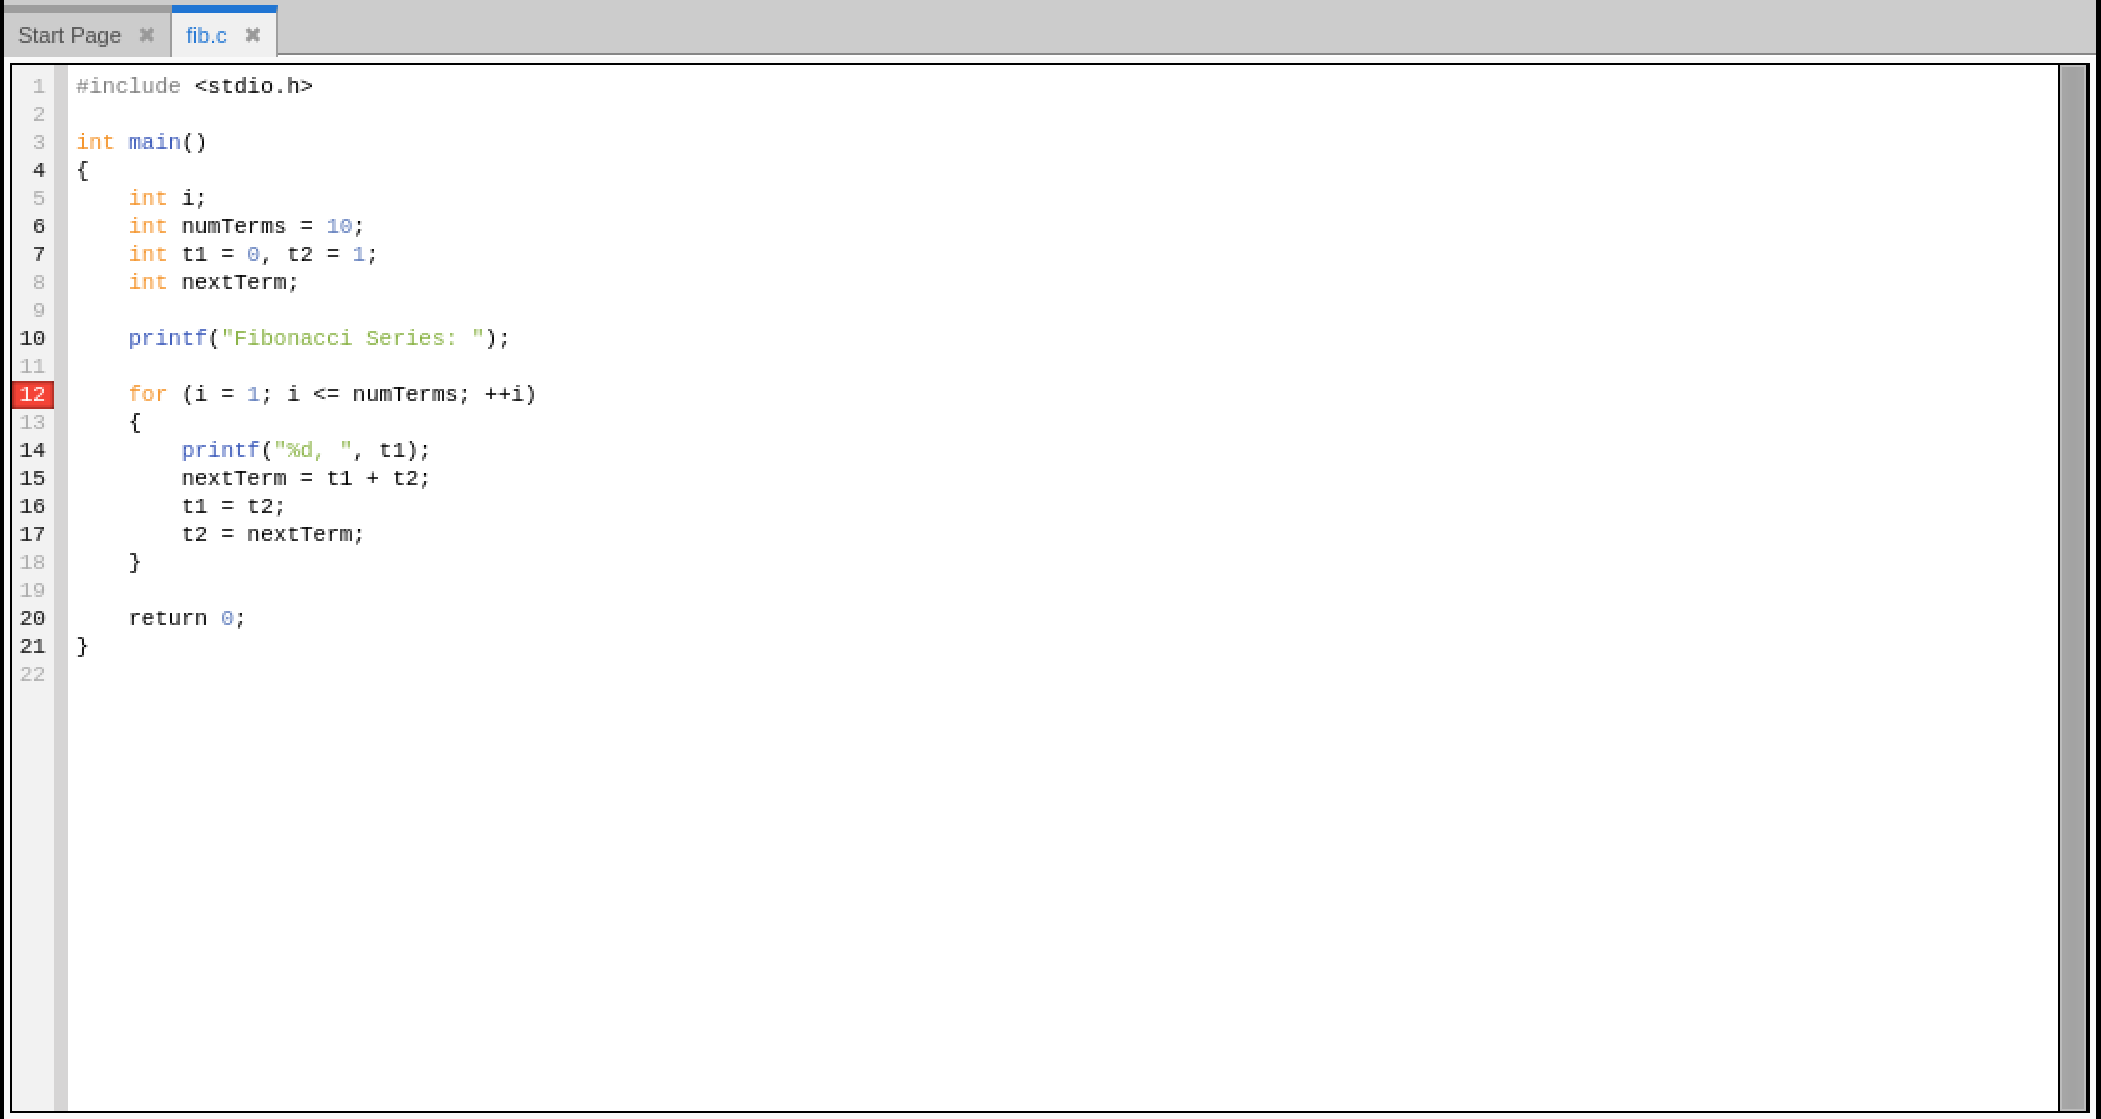
1. Create a file called fib.c
#include <stdio.h>

int main()
{
    int i;
    int numTerms = 10;
    int t1 = 0, t2 = 1;
    int nextTerm;

    printf("Fibonacci Series: ");

    for (i = 1; i <= numTerms; ++i)
    {
        printf("%d, ", t1);
        nextTerm = t1 + t2;
        t1 = t2;
        t2 = nextTerm;
    }

    return 0;
}
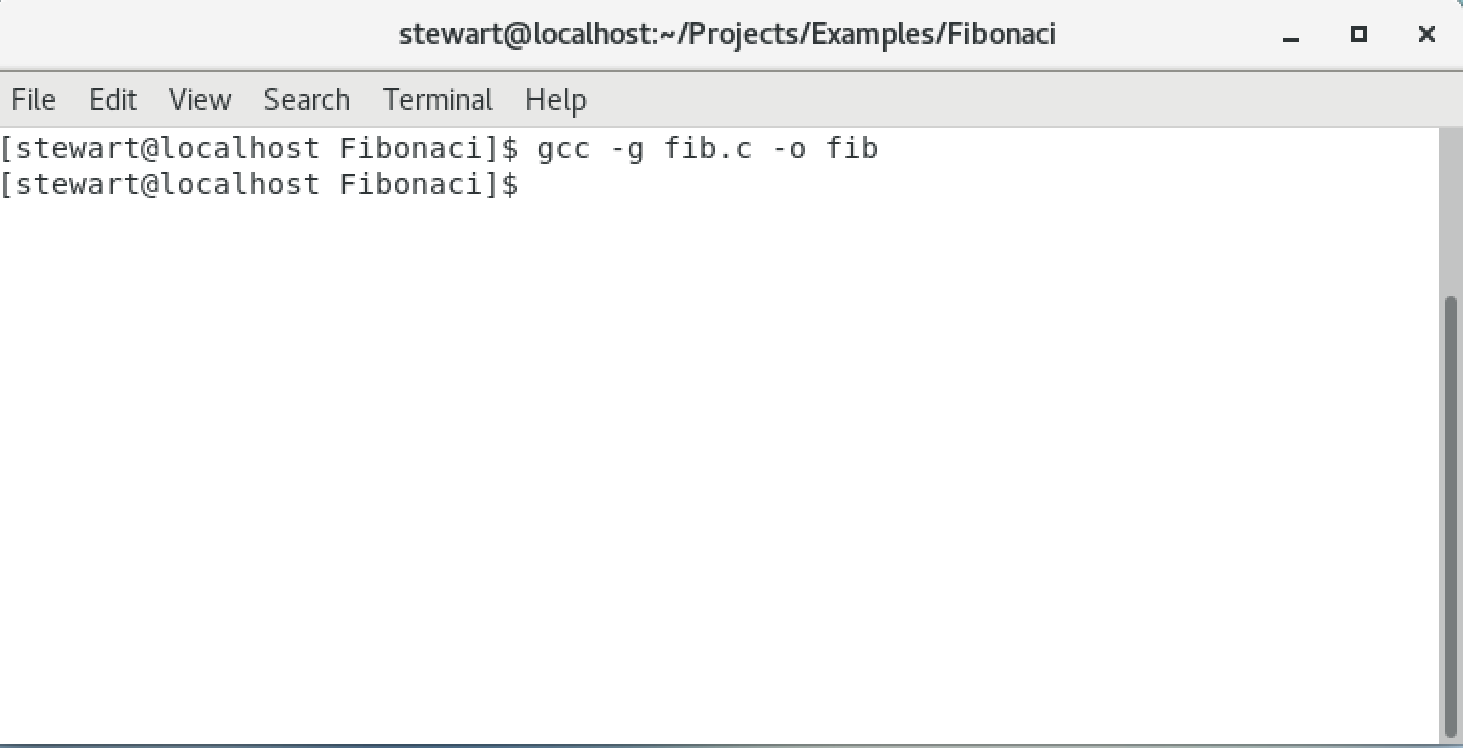
2. Compile the fib.c file using the gcc compiler and the -g flag to enable debug symbols.
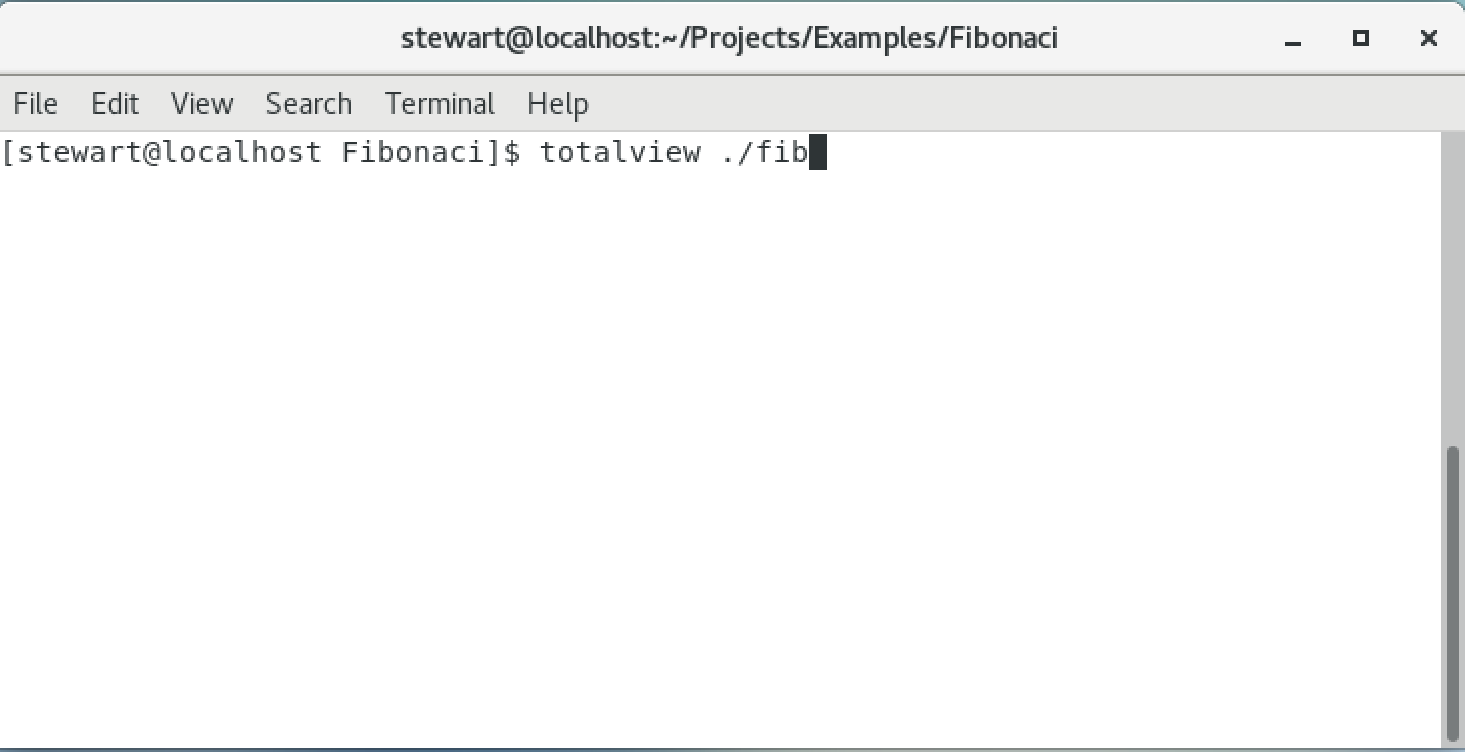
3. Start TotalView and debug the fib application.
4. Set a breakpoint at line 12 by clicking on the line number.
5. Start debugging by pressing the Green GO button. TotalView runs the program to the breakpoint at line 12 and then stops.
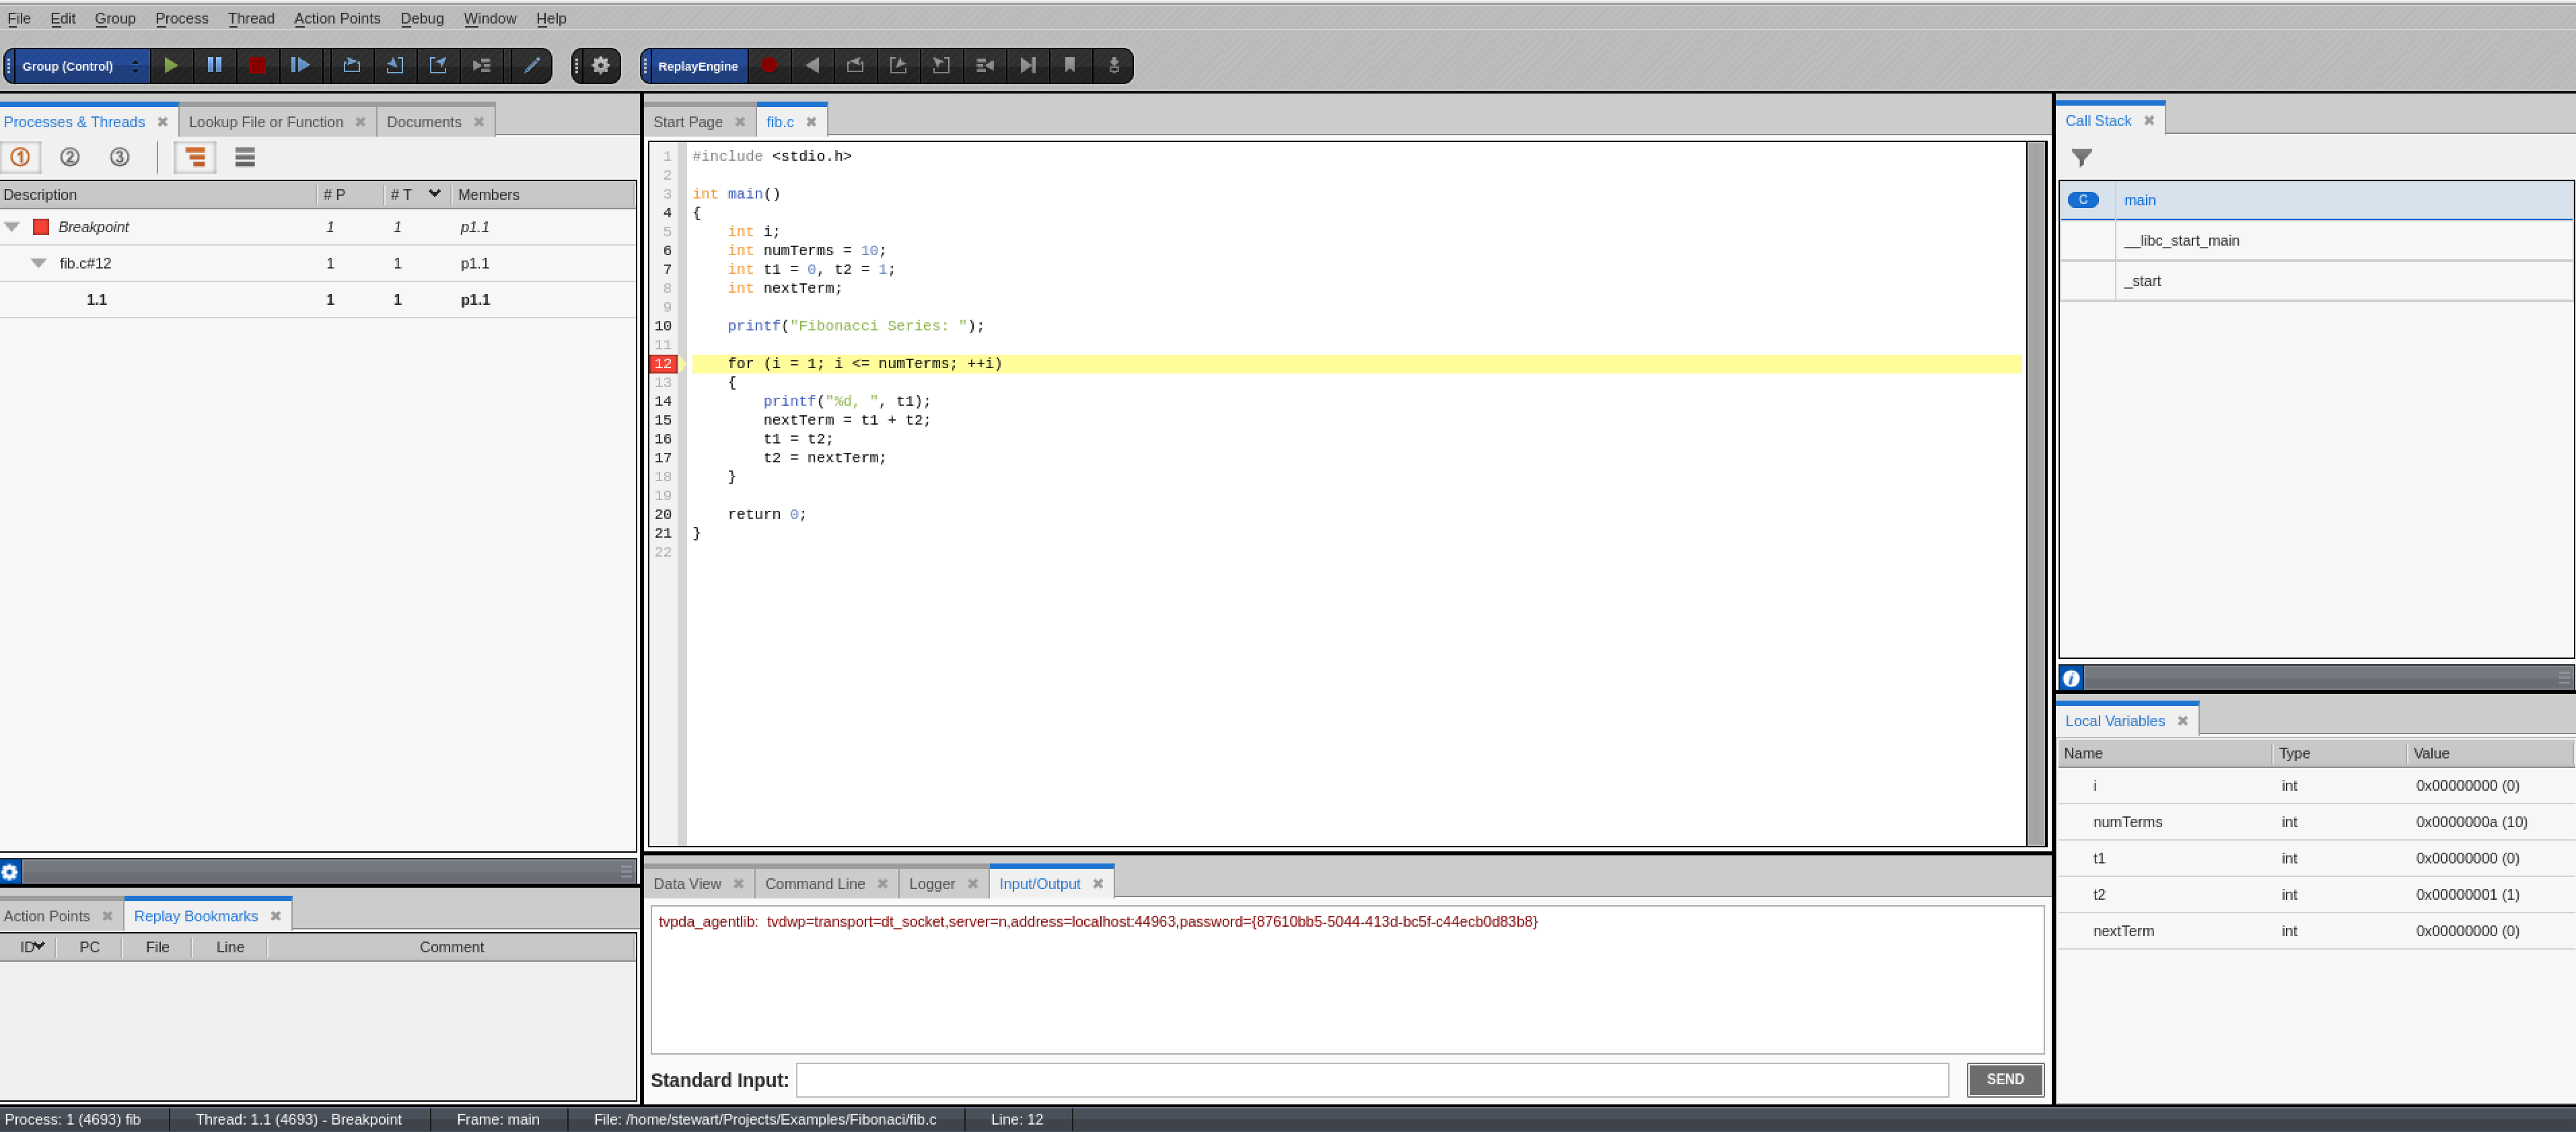
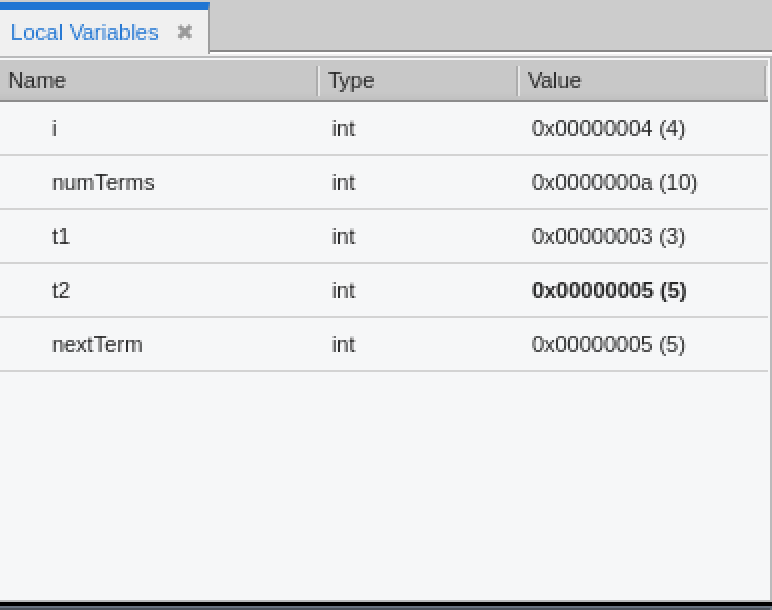
6. Use the Next button to step through the loop and watch the values of the variables in the Local Variables window change as you do so.
7. A unique feature TotalView provides is the ability to record the execution of your program so you can step back through the execution history.
Try turning on reverse debugging through the Replay Engine toolbar by pressing the Red Record button and then stepping backward as well as forwards through the code.
Watch this video tutorial on Reverse Debugging.
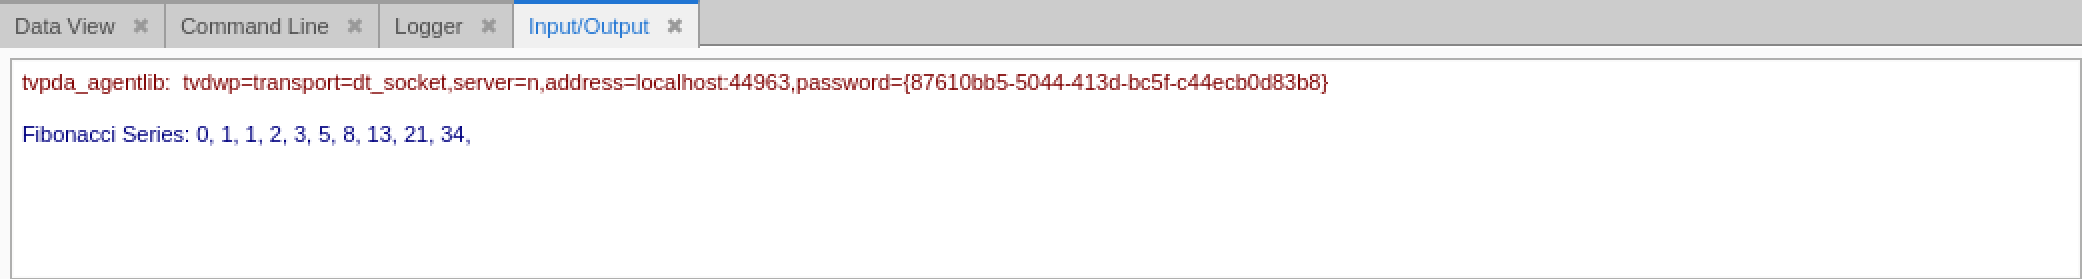
8. Run the program to completion either by disabling the breakpoint and pressing GO or by pressing Next multiple times until the for loop completes and observe the output in the Input / Output window.
If the Input/Output View is not open, select it from the Window > Views > Input/Output menu item.
Next Steps
This step by step guide showed you how to debug in C, starting with compiling a simple C application and using TotalView graphical debugger.
Test TotalView's debugging capabilities with your application today.
Related Resources
- How to Debug C++ Applications in Docker Containers
- Video Tutorials
- Move Your Development Forward With Reverse Debugging
- Best Practices For Your API Versioning Strategy
