
Solving Tough Dangling Pointer Problems with TotalView
About TotalView
TotalView is a high-performance debugging tool for C, C++, and Fortran applications running on Linux, UNIX, and macOS platforms. It provides debugging support for multi-threaded, multi-process applications, and GPU accelerators. It scales from debugging complex applications on a laptop or workstation to the world’s largest supercomputers. TotalView provides an easy-to-use interface that supports local as well as remote debugging. Let’s learn how to use TotalView’s powerful debugging features to solve a tough memory corruption problem.
Table of Contents
The Problem
A program uses C++’s standard regular expression functionality to split a string with a directory path such as “directory1/directory2/directory3” into individual directory1, directory2, and directory3 string segments. Sometimes the program runs fine. Other times the program finishes but doesn’t process the whole string and the results are mangled. Occasionally the program crashes. The following is the output of the application piped through ‘cat -v’ to convert special characters into printable ASCII characters.
$ ./DanglingPointerSample | cat -v
Splitting directory1/directory2/directory3
Match:
Splitting again @^FM-p^A
Final: @^FM-p^A
The program should generate the following output:
Splitting directory1/directory2/directory3
Match: directory1
Splitting again directory2/directory3
Match: directory2
Splitting again directory3
Final: directory3
When a program exhibits sporadic data issues and crashes, developers should suspect that the program might be improperly managing allocated memory off the heap. There are two main culprits to investigate, accessing memory before it is initialized and accessing memory after it has been freed, which is done by accessing the memory through a dangling pointer.
Diagnosing the Problem
Sporadic crashes and data issue problems are tough to solve. Using TotalView’s memory debugging technology in conjunction with other TotalView debugging features will greatly aid in isolating and diagnosing the problem so that a fix is quickly determined. Let’s begin by understanding the debugging features we will leverage in TotalView to solve the problem.
Back to topMemory Debugging with TotalView
There are a variety of open-source and commercial tools for finding memory problems in C/C++ and Fortran programs. Some require instrumentation of source or object code which requires a preparation step by the developer to find memory issues. Others execute code within a virtual CPU which doesn’t require any preparation of the program but, incurs a performance penalty. TotalView’s memory debugging technology uses a proxy technique using a Heap Interposition Agent (HIA). TotalView requires no special instrumentation of the target application and instead uses the dynamic loading facilities within the operating system TotalView to inject its HIA library between calls to memory functions from the application to the operating system. Using this technique, any calls to malloc/free, new/delete, or other memory management functions first go through the HIA equivalent function and then are passed to the operating system. Along the way, TotalView keeps track of memory being allocated or deallocated. TotalView can also manipulate memory blocks during the processing to initialize a new block of memory or stripe a pattern into a freed block of memory. From this basic HIA functionality the following memory debugging features provide powerful capabilities for finding memory problems in your application:
- Heap Usage:
Track allocated and deallocated memory blocks, so that developers can understand how much memory is allocated by locations of their program. Examining heap usage allows developers to identify issues such as when a program is allocating and caching large amounts of memory. - Memory Leaks:
Find incorrect management of allocated memory that result in memory leaks. - Out of Bounds Memory Writes with Guard Blocks:
Discover critical memory write flaws that result in memory blocks being overwritten. - Memory Block Painting:
Paint newly allocated and freed memory blocks with a consistent pattern to provoke consistent failures in an application that is reading memory before it is initialized by the application. - Memory Block Hoarding:
Hoard memory blocks instead of freeing them through the operating system to keep memory contents stable and prevent the memory block from being reallocated after it is freed. This advanced technique is helpful when solving dangling pointer problems. - Dangling Pointer Annotation:
Real-time pointer feedback that clearly indicates if the pointer is referencing allocated or freed memory.
To solve our program’s sporadic failure, we will leverage guard blocks to make sure our program does not write beyond the end of any memory blocks, memory block painting to stabilize the contents of our memory block memory during initialization and after it is freed, and memory block hoarding to prevent the block from being reclaimed and reissued to the program. Finally, we’ll observe TotalView’s annotation of memory blocks to detect any dangling pointers, which are memory pointers pointing to deallocated blocks of memory.
Back to topReverse Debugging
TotalView provides the ability to deterministically record and replay the execution of your program so that developers can debug backwards through the execution history just like when forward debugging through normal program execution. Reverse debugging allows developers to run backwards to breakpoints, examine data in recorded history, and even save the full recording file so it can be analyzed later. Leveraging a debugging session with reverse debugging saves the developer an enormous amount of time by allowing them to do all their debugging analysis within one debugging session instead of across numerous restarted debugging sessions.
Back to topOther TotalView Debugging Features
Throughout this debugging exercise we’ll leverage several other debugging features in addition to TotalView’s memory and reverse debugging capabilities.
- Data debugging and type casting:
TotalView’s Data View provides advanced insight and debugging of the program’s data. - Watchpoints:
TotalView provides four action point mechanisms to control program execution: breakpoint, EVAL points, unconditional watchpoints, and condition watchpoints. Watchpoints utilize hardware registers to watch for writes to a piece of memory. When the memory changes, program execution is halted allowing the developer to see exactly where their program changed the memory.
Download and Building the Target Application
This article will debug an application that incorrectly uses the C++ std::regex_search and associated methods to search through a string of directory paths and extract each path name between the backslash delimitator.
The sources for the application are available for download here. To build the target program you will need cmake installed. Follow the instructions below to build the target program used in this article.
- Download the source tar bundle
- Extract the directories and files from the tar bundle with the command:
tar xvf TotalView2023.2Blog.tar
- Two directories are extract:
DanglingPointerSample– A broken version of the application that will be debugged in this article.DanglingPointerSampleFixed– Two fixed versions of the application. One that contains the fix recommended in this article,DanglingPointerSampleFixed, and a final version,DanglingPointerSampleFixedNoLeaks, that fixes memory leaks in the application. - Build the target applications as follows:
- Change directory into the broken version of the application:
cd DanglingPointerSample - Generate the makefiles using cmake:
cmake . Build the application with make
make- The final executable is placed in the bin directory
- Change directory into the broken version of the application:
- Use the same procedure as in step #4 to build the fixed version of the applications in directory
DanglingPointerSampleFixed. BothDanglingPointerSampleFixedandDanglingPointerSampleFixedNoLeakswill be placed in the bin directory.
Debugging the Target Application
The test program exposes several C routines that internally utilize the C++ std::regex_search method. This approach can be useful when combining a C program with Fortran or as a Python module. The overall execution flow of the target application is as follows:
- Define the string to search.
- Create the regular expression that will be used against the search string with a call to create_regex_c.
- Loop by calling search_regex_c repeatedly and for each successful search:
- Grab the match string with a call to match_prefix_regex_c and display the string.
- Get the remaining string to search with a call to match_suffix_regex_c and output the remaining string left.
- Finally, display any remaining string left.
Start TotalView Debugging Session and Configure Debugging Options
Begin the debugging session through the command line by running TotalView and specifying the DanglingPointerSample application from within the DanglingPointerSample/bin directory. The following assumes TotalView’s installed bin directory has been added to the shell’s search PATH environment variable.
cd DanglingPointerSample/bin totalview DanglingPointerSample
With the program loaded, enable reverse debugging by toggling the Record button in the ReplayEngine toolbar:
Next, enable memory debugging by clicking the Enable memory debugging icon in the toolbar:
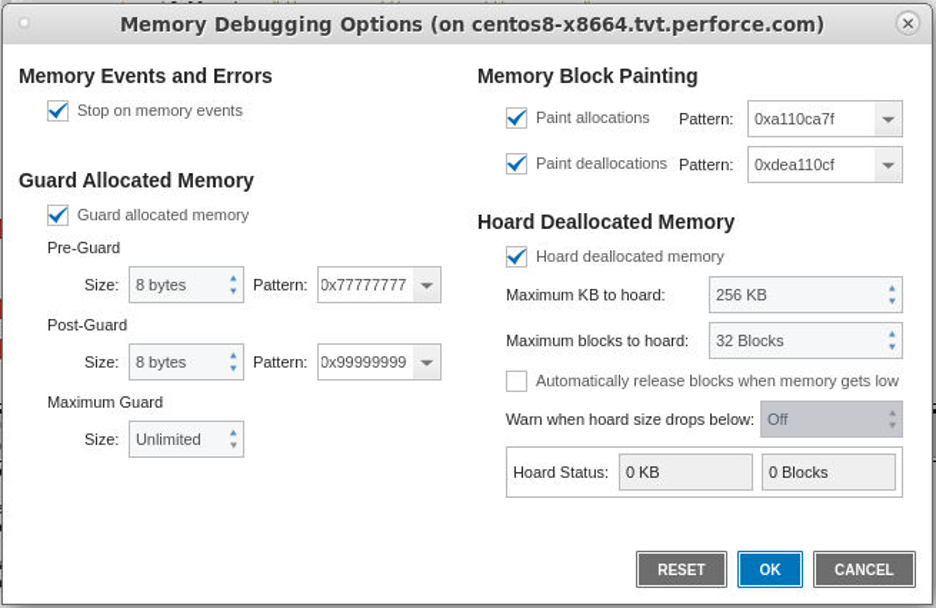
Finally, click the “gear” icon in the Memory toolbar to bring up the Memory Debugging Options dialog and enable the Stop on Memory Errors, Paint memory, Hoard deallocated memory, and Guard allocated memory options.
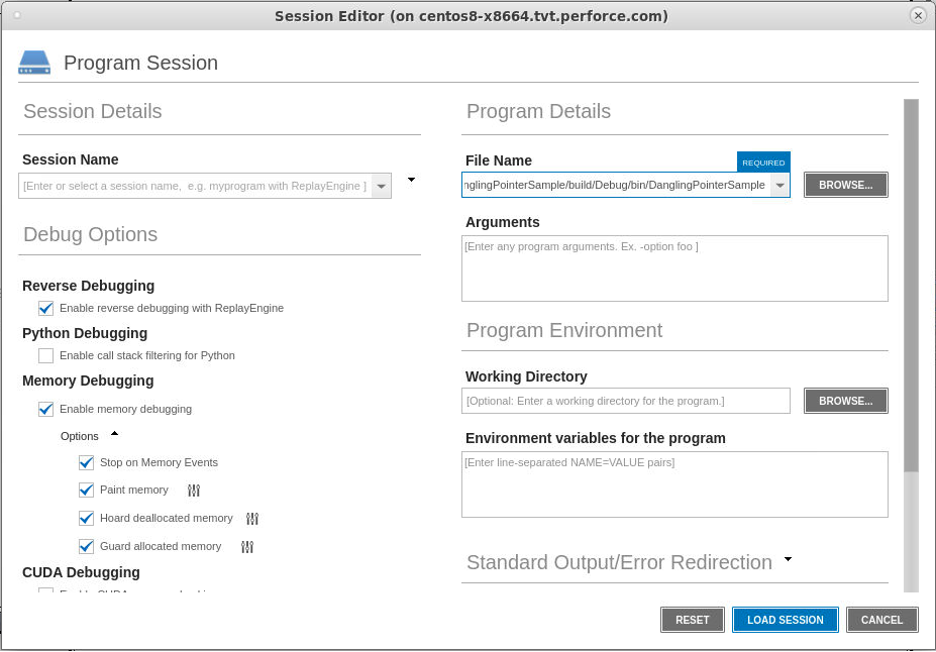
Alternatively, debugging sessions can also be created through the TotalView user interface by clicking on the “Debug a Program” option from the start page. Next, provide the program information in the Program Session dialog. While on the Program Session page, turn on Reverse Debugging and Memory Debugging under the Debug Options section. Also, enable the Stop on Memory Errors, Paint memory, Hoard deallocated memory, and Guard allocated memory options.
 Back to top
Set Breakpoint Locations
There are some key locations in the program that we want to examine the results of searching for string matches with the regular expression pattern matching.
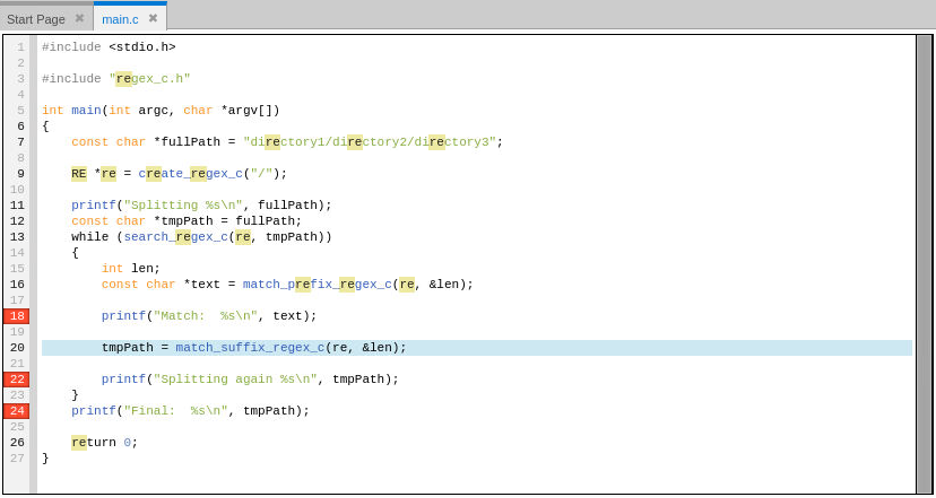
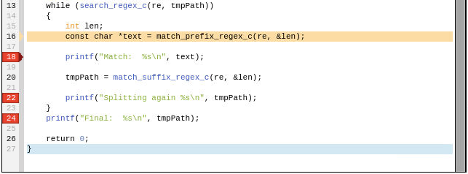
Initially, set breakpoints at lines 18, 22, and 24 of main.c by clicking on the line number in the gutter of the source display. These lines are where the program prints out results of the regular expression routines.
 Back to top
Debug the Program
With breakpoints set, run the program by clicking the green “Go” arrow in the program control toolbar. Once we stop at a breakpoint, we’ll leverage TotalView’s reverse debugging to easily step backwards in the program execution to examine what may have happened to generate the bad output.
main.cpp#18 Breakpoint
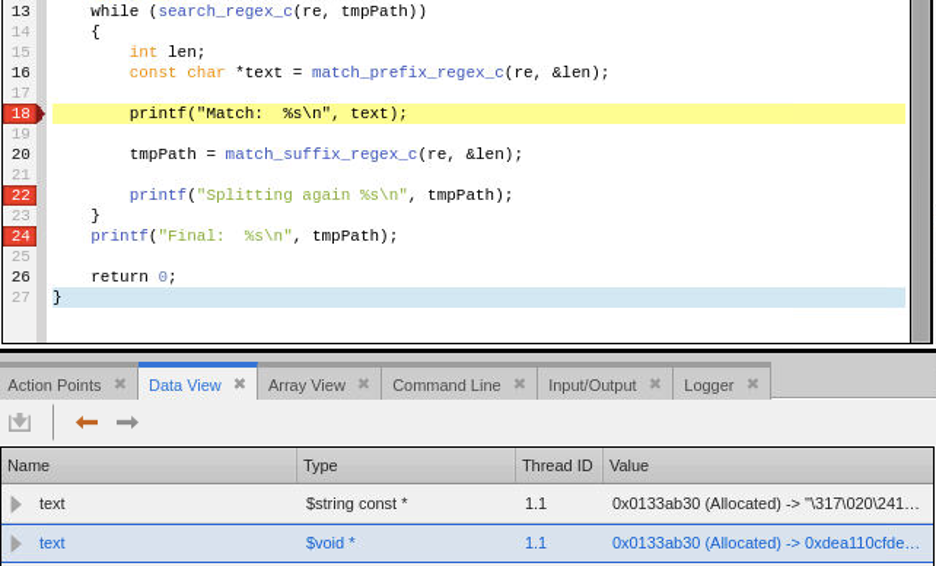
While at the breakpoint on line 18, add the variable text to the Data View either by right clicking the variable name in the source area and selecting “Add to Data View” or by just typing the name as a new expression in the Data View.
Within the Data View, the pointer for variable “text” is marked as Allocated and appears valid but the text is not what we expect. Examine the raw memory for the pointer by double clicking the type for the expression and casting it to a “void *”. Interestingly, the pattern is 0xdeallocfde…, which is the memory debugging paint pattern used for deallocated memory blocks. This is a first clue that we are viewing memory that at one point had been deallocated. Let’s explore further.
The result assigned to text comes from a call to match_prefix_regex_c. Let’s use TotalView’s reverse debugging capabilities to step backwards through the recorded history and go back to the call at line 16. Press the “Prev” button to reverse step back to line 16.
The source display shows a red arrow in the gutter at line 18, indicating the live position of the program, and a beige arrow at line 16, indicating where the PC is in recorded history of the program.
Next, step into match_prefix_regex_c by using the Step button in the program control toolbar.
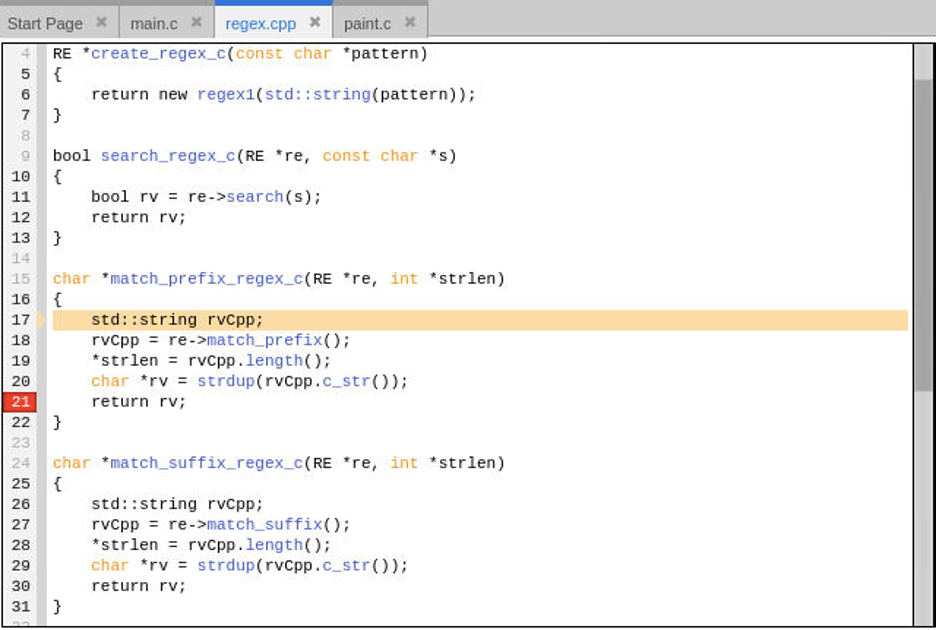
The current line is now at line 17 in function match_prefix_regex_c of file regex.cpp.
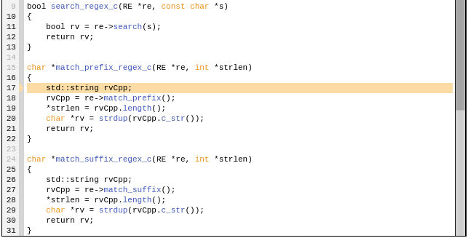
To control execution beyond the end of match_prefix_regex_c, set a breakpoint at line 21. Click Go to run forward through recorded history to the breakpoint at line 21.
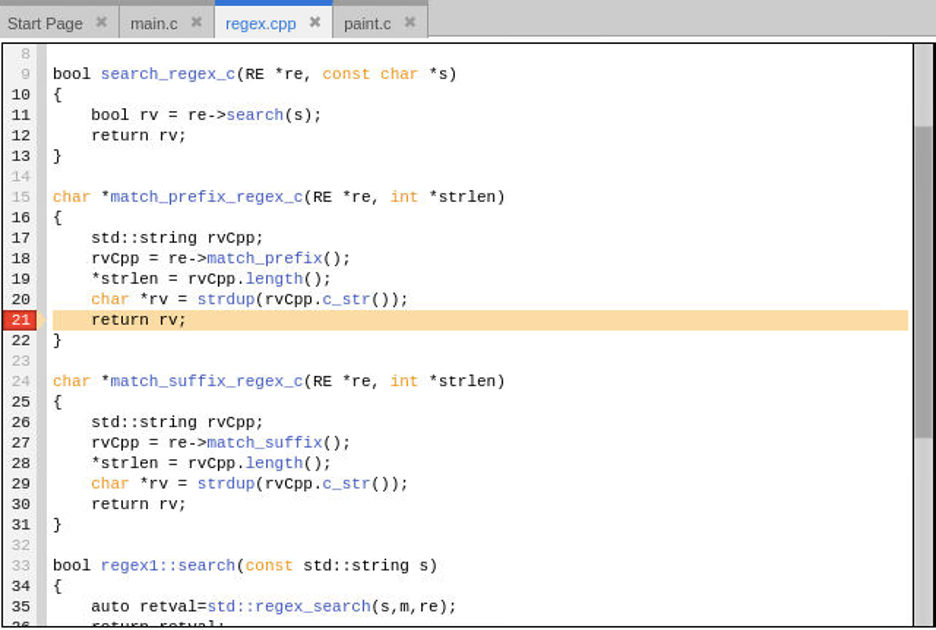
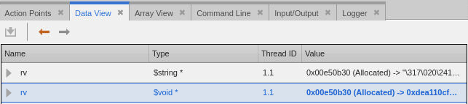
Adding variable rv to the Data View and examining its value as a string and void * confirms it is the same as what was observed with the text variable in the main routine.
Variable rv is a copy from std::string rvCpp which was assigned from a call to re->match_prefix(). Let’s explore the re->match_prefix method to understand where the bad string is returned from. Do this by clicking on line 17 to highlight it in light blue and then press the Back To button in the ReplayEngine toolbar to run back to the selected line. We are going back to line 17 to get past any intermediary code that occurs during the assignment of the variable rvCpp on line 18.
Once back on line 17, click the Step to advance forward to line 18 and then Step again to step into the call to re->match_prefix().
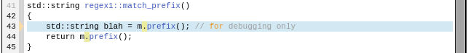
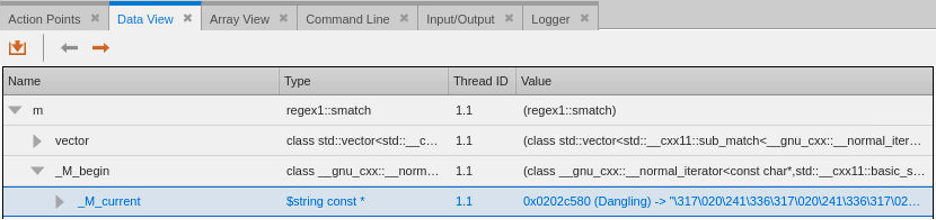
Method match_prefix returns the matching prefix string by calling m.prefix(). Variable m is of type std::smatch and is filled with regular expression matches after a call to std::regex_search has been made. Examining the contents of variable m and navigating down to its _M_begin and then _M_current data members in the Data View shows that _M_current is a pointer to a string but TotalView has indicated the pointer is dangling!
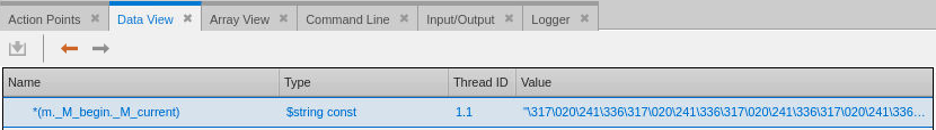
Somewhere the memory that _M_current is supposed to point to has been freed. Let’s examine the data further by right clicking on _M_current and select Dive and then expand the $string const * pointer to show its data.
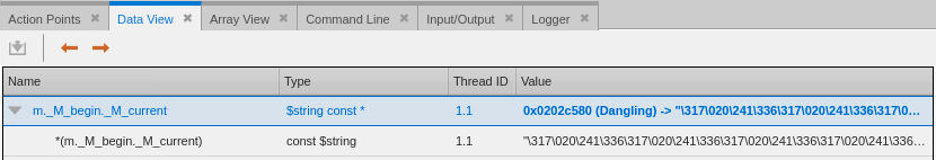
We need to Dive one more time to properly examine the data the pointer is pointing too. Right click on the *(m._M_begin._M_current) data item and Dive on it to examine the data directly.
Finally, cast the data from a $string const to void by double clicking on the type field and entering the new void type.
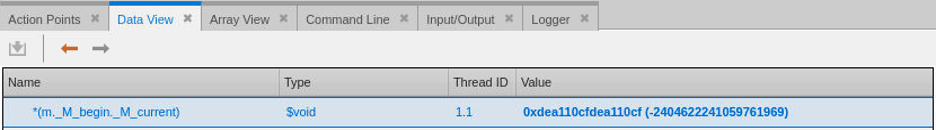
When memory is freed during execution of the program TotalView’s memory debugging feature will fill the memory block with the hexadecimal pattern 0xdeall0cf. To find out exactly when this happened during program execution we will run backwards until the point the memory was painted with the pattern. This will be the point the memory was freed and will help us determine the source of the dangling pointer problem. To easily find this location, use TotalView’s watchpoint feature to watch a segment of memory and halt the execution of the program when the memory changes.
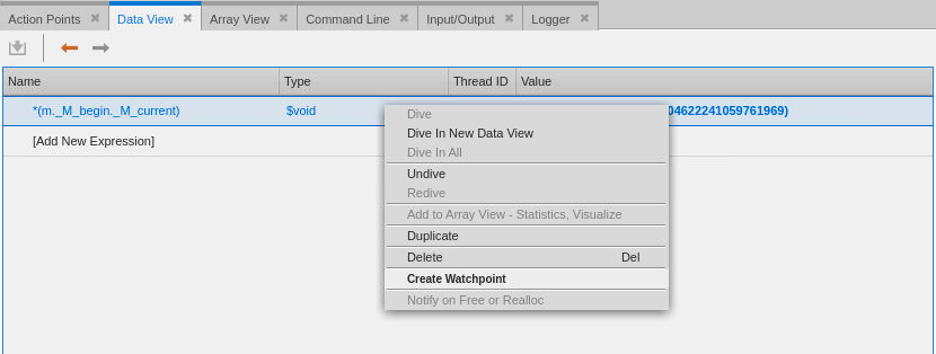
To create the watchpoint, right click on the *(m._M_begin._M_current) expression in the Data View and select Create Watchpoint from the popup menu.
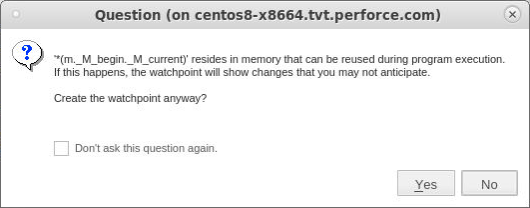
TotalView will give a notice about how this watchpoint could be triggered every time memory at this location is reused. Click Yes to continue creating the watchpoint.
Everything is ready to find the location memory is freed. Press the green Go Back arrow button in the ReplayEngine toolbar to begin running backwards.
TotalView will halt execution of the program when the block of memory is changed. This happens within TotalView’s memory debugging agent called the Heap Interposition Agent (HIA) in. The initial Call Stack will show the program stopped in routine TV_HEAP_paint_block, the actual location where the memory was being overwritten during the memory debugging paint of free operation.
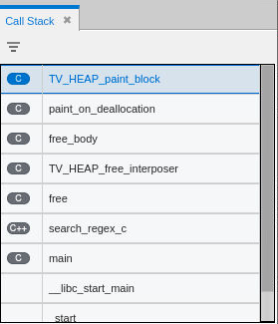
To examine where in the program the free was called click on the search_regex_c stack frame, which is the stack frame just above the “free” stack frame and is the location where the call to free occurred.
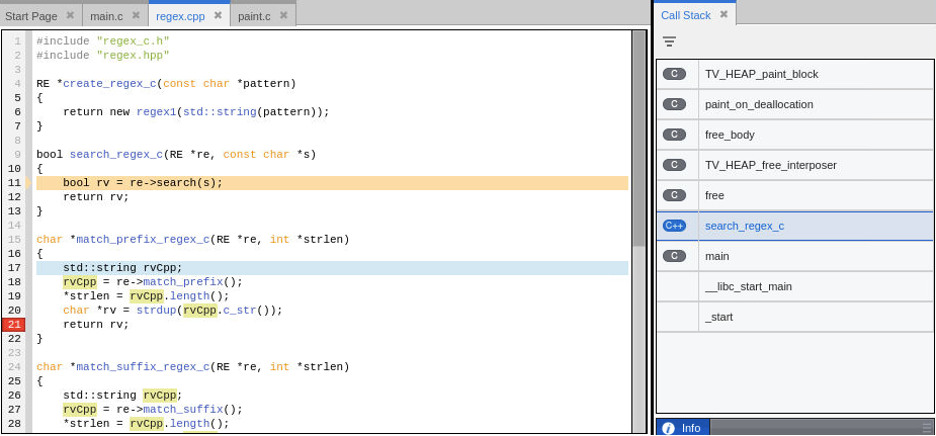
Somewhere between line 11 and the call to re->search and line 13 the memory is freed and is painted with the deallocation pattern. Where is the call to free? To understand where the free is occurring examine the function signature for the call to re->search(s), which is method regex1::search in file regex.cpp.
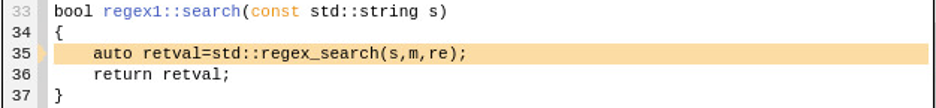
The method accepts a const std::string type. The call to re->search at line 11 in regex.cpp passes in a const char * though. The compiler will create a temporary std::string on the stack in order to meet the requirements of the call to regex1::search. Internally, depending on the length of the string, std::string will make a copy of the incoming const char * string. Normally, creating a temporary would not be a problem if the routine did not hold onto any pointers from the temporary string but the resulting call to std::regex_search and subsequent calls to search the string with std::match_results, std::match_prefix, and std::match_suffix require the incoming std::string memory to remain available. The description of std::match_results at cppreference.com clearly articulates this requirement, “Because std::match_results holds std::sub_matches, each of which is a pair of iterators into the original character sequence that was matched, it's undefined behavior to examine std::match_results if the original character sequence was destroyed or iterators to it were invalidated for other reasons.”
Unfortunately, after execution returns from the call to regex::search the temporary string is destroyed, so subsequent calls to search the string with std::match_* result in access memory that has been freed and most likely will contain invalid data.
Back to topFixing the Problem
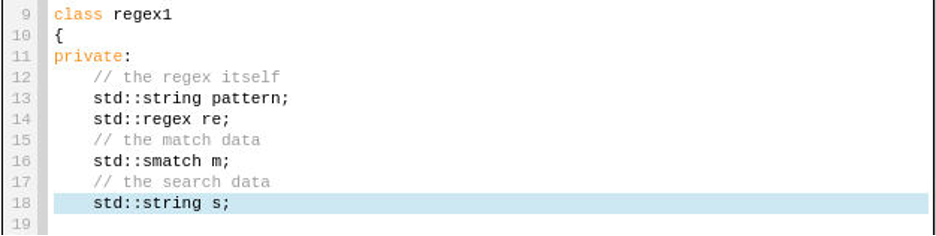
Now that the problem has been identified the fix is relatively simple. The search string passed to std::regex_search must remain available for subsequent calls to any of the std::match_* calls including our call to std::match_prefix in regex1::match_prefix. This is easily be accomplished by adding a new search string member s to the regex1 class.
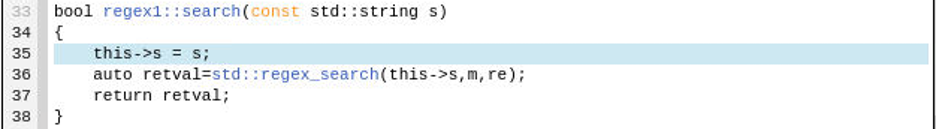
First, modify regex.hpp and add “std::string s” to the private block of class members as shown in line 18 below.
Next, initialize member s by adding “this->s = s;” as shown in line 35 below and then modify the first argument to the std::regex_search call to be this->s instead of s as shown on line 36.
Recompile the program after applying the fixes, load the program in TotalView one more time, turn on memory debugging, and run it again. The download DanglingPointerSampleFixed directory and executable named DanglingPointerSampleFixed in the bin directory contains the above fix.
The program generates the proper output this time.
Splitting directory1/directory2/directory3
Match: directory1
Splitting again directory2/directory3
Match: directory2
Splitting again directory3
Final: directory3
Just before the program exits TotalView’s memory debugging checks the program for memory leaks and will ask if you would like to see a leak report. The leak reports shows that this program is generating numerous memory leaks.
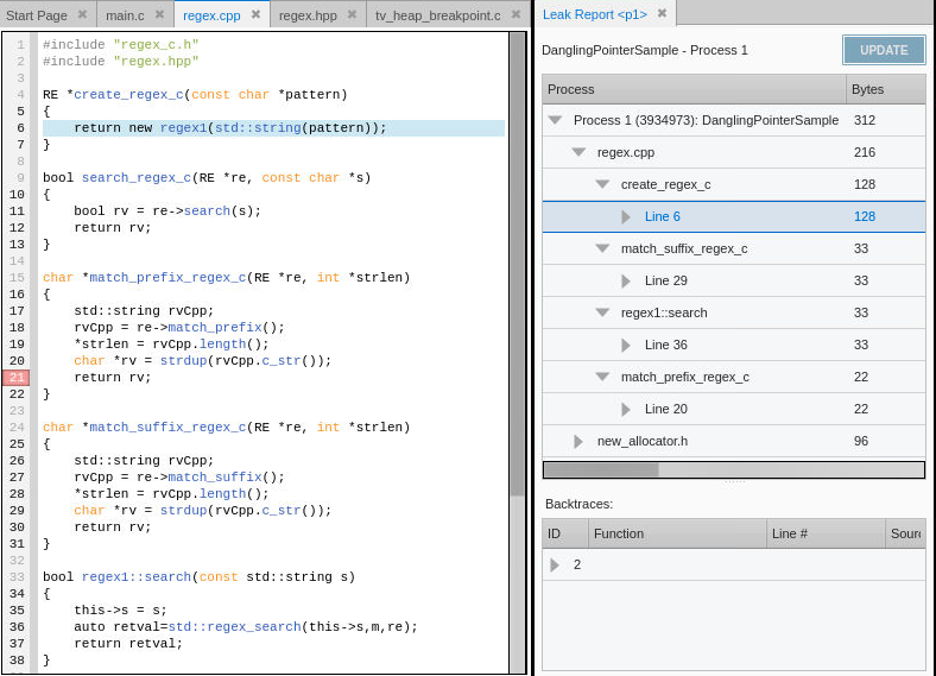
Drilling down into the Leak Report shows memory leaks generated from allocations in create_regex_c, match_suffix_regex_c, regex1:search, and match_prefix_regex_c. TotalView shows the source of the leak and individual stack backtraces of the call sequences the resulted in the memory allocation. This information provides the developer with the details needed to understand where the memory was allocated and to fix the code to properly free the memory when they are done with it. A leak free version of the program is built using source files modified to resolve the leaks. The final leak free version of the program is built as DanglingPointerSampleFixedNoLeaks in the DanglingPointerSampleFixed project directory.
Next Steps
This article detailed how to solve a tough dangling pointer memory problem using TotalView’s powerful debugging features. The techniques and features utilized are useful for solving many other types of problems occurring in code too. Check out short videos demonstrating TotalView’s debugging features at TotalView’s Video Tutorials page. Want to try TotalView and experience its advanced debugging features? Sign up for a free trial!
Back to top
